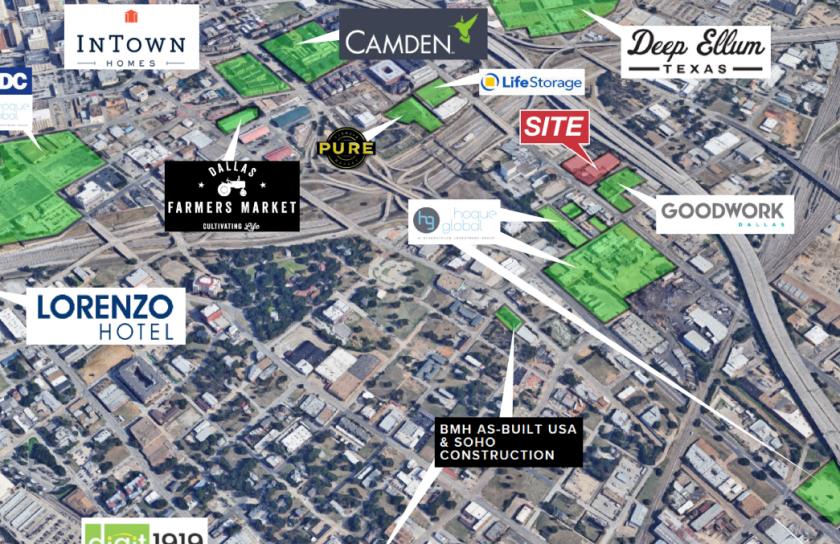
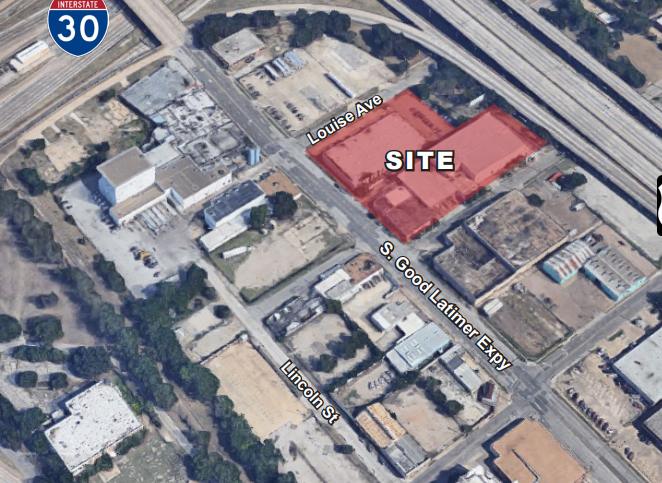
1-Mile | 3-Miles | 5-Miles | ||
---|---|---|---|---|
Total Population | 10,105 | 140,151 | 344,165 | |
Population Median Age | 38 | 35 | 36 | |
Population by Age | 0-9 Yrs | 500 (4%) | 14253 (10%) | 42662 (12%) |
10-19 Yrs | 400 (3%) | 11166 (7%) | 35969 (10%) | |
20-29 Yrs | 2921 (28%) | 36071 (25%) | 70865 (20%) | |
30-39 Yrs | 2165 (21%) | 28520 (20%) | 59712 (17%) | |
40-49 Yrs | 1261 (12%) | 15897 (11%) | 43060 (12%) | |
50-59 Yrs | 1636 (16%) | 16652 (11%) | 42350 (12%) | |
60-69 Yrs | 886 (8%) | 10137 (7%) | 28644 (8%) | |
70+ Yrs | 337 (3%) | 7455 (5%) | 20902 (6%) | |
Median HH Income | $57,807 | $59,722 | $59,206 | |
Total Household Income | < 24K | 1063 (21%) | 15268 (23%) | 33142 (22%) |
25-49K | 1122 (22%) | 13068 (19%) | 29191 (20%) | |
50-74K | 1023 (20%) | 11508 (17%) | 24988 (17%) | |
75-99K | 512 (10%) | 7724 (11%) | 16128 (11%) | |
100-199K | 1115 (22%) | 13021 (19%) | 26078 (17%) | |
200K+ | 146 (2%) | 5594 (8%) | 15644 (10%) | |
Highest Education Level | No Diploma | 1022 | 20075 | 50277 |
Diploma or GED | 1347 | 16513 | 42304 | |
Some College | 1604 | 16583 | 36482 | |
Assoc. Degree | 512 | 3949 | 9130 | |
Bachelors Degree | 2610 | 27889 | 60587 | |
Higher Degree | 1181 | 16741 | 38596 | |
Total Housing Units | 5,931 | 77,450 | 166,287 | |
--Owner-Occupied | 623 | 15,911 | 54,894 | |
--Renter-Occupied | 4,358 | 50,271 | 90,278 | |
Owner-Occupied Values | < 100K | 153 | 4178 | 14204 |
100-199K | 121 | 2965 | 10534 | |
200-299K | 39 | 2018 | 5686 | |
300-399K | 126 | 2231 | 6214 | |
400-499K | 67 | 1562 | 4333 | |
500K+ | 117 | 2958 | 13923 | |
Total Working Age Population | 9,388 | 118,841 | 279,437 | |
In Work Force | 6,441 | 85,792 | 190,602 | |
Not In Work Force | 2,947 | 33,049 | 88,834 | |
Workforce Employed | 6,208 | 81,410 | 181,319 | |
Workforce Unemployed | 233 | 4,337 | 9,184 | |
Civlian Workforce | 6,441 | 85,747 | 190,503 | |
Military Workforce | 0 | 45 | 100 | |
Total Households | 4,981 | 66,182 | 145,172 | |
Family Households | 1,264 | 24,547 | 67,909 | |
Non-Family Households | 3,717 | 41,635 | 77,263 | |
Married Couple | 839 | 14,319 | 43,918 | |
Other Family | 425 | 10,228 | 23,991 | |
Married w/Child | 130 | 4,093 | 17,085 | |
Single Male w/Child | 82 | 1,271 | 2,578 | |
Single Female w/Child | 157 | 4,059 | 9,422 |
Population Change Last Two Decades - Plus Projection
2000 | % | 2010 | % | 2020 | % | 2030 | |
---|---|---|---|---|---|---|---|
Texas | 20,851,820 | +21 | 25,145,561 | +18 | 29,677,668 | +18 | 34,894,452 |
Dallas County | 2,218,899 | +7 | 2,368,139 | +15 | 2,734,111 | +14 | 3,106,298 |
Total Working Age Population:
Total Households:
Total Working Age Population:
Total Households:
Total Working Age Population:
Total Households: