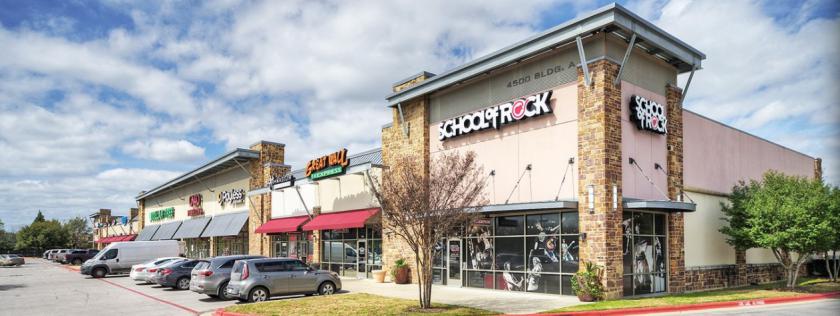
Retail Space
4500 E Palm Valley Blvd Round Rock, TX 78665
4500 E Palm Valley Blvd Round Rock, TX 78665
Details & Description
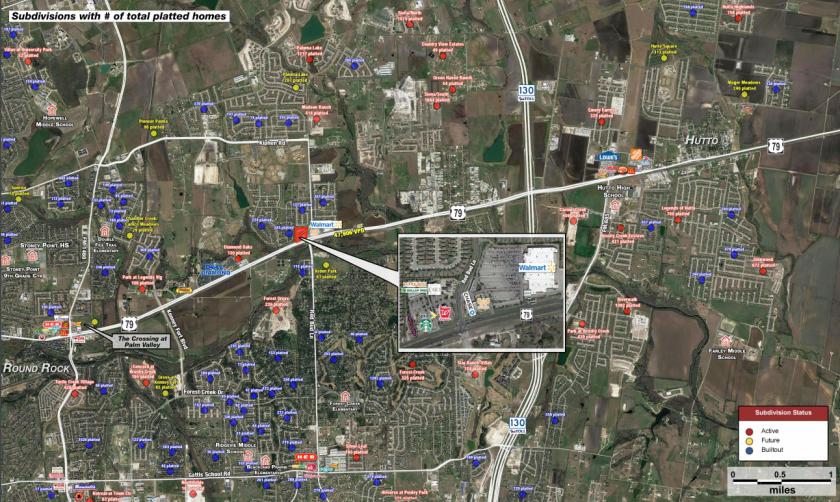
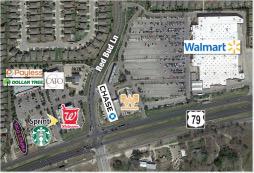
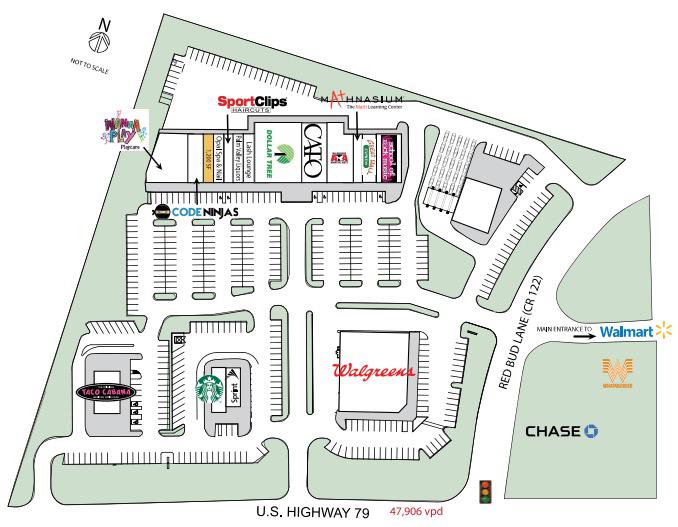
Additional Photos
Listing Agents

Brett Maze
O: 512-275-2004
M: 512-865-7400
bmaze@weitzmangroup.com
O: 512-275-2004
M: 512-865-7400
bmaze@weitzmangroup.com
While we strive to provide the most accurate information, all listing information, and demographic data, is provided by third-parties. As such, MyEListing will not be responsible for the accuracy of the information. It is strongly recommended that you verify all information with the listing agent, and any relevant agencies, prior to making any decisions.


