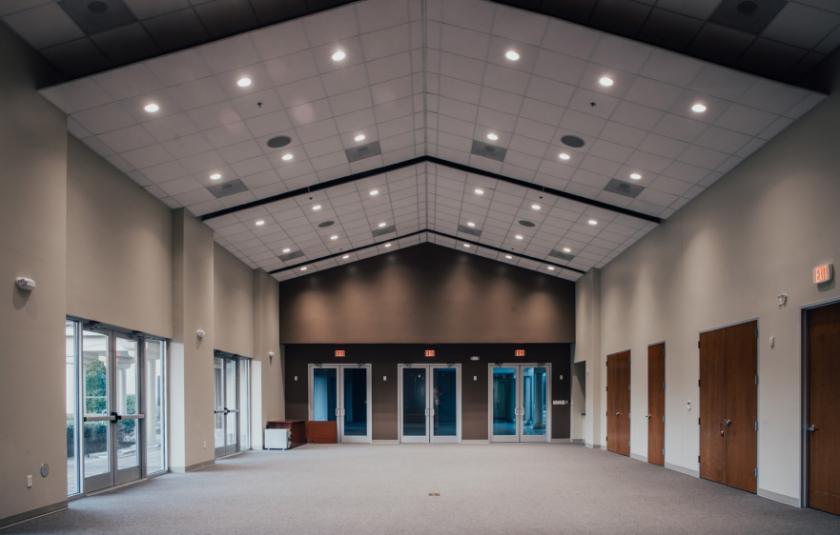
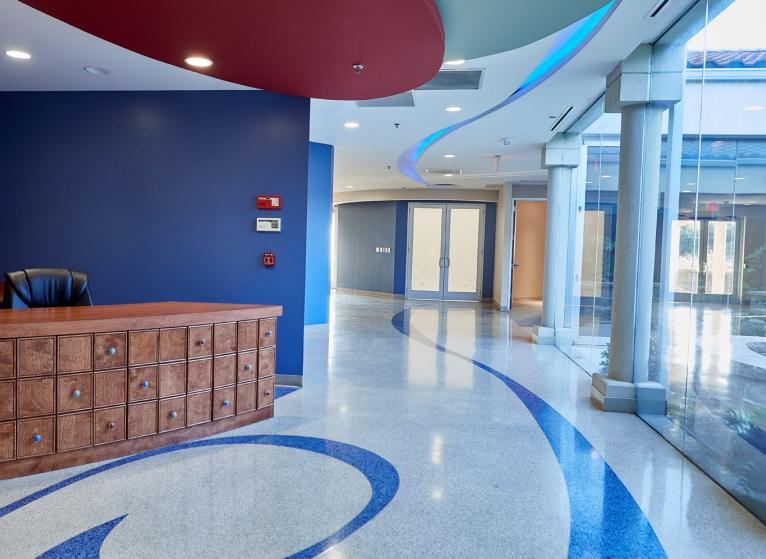
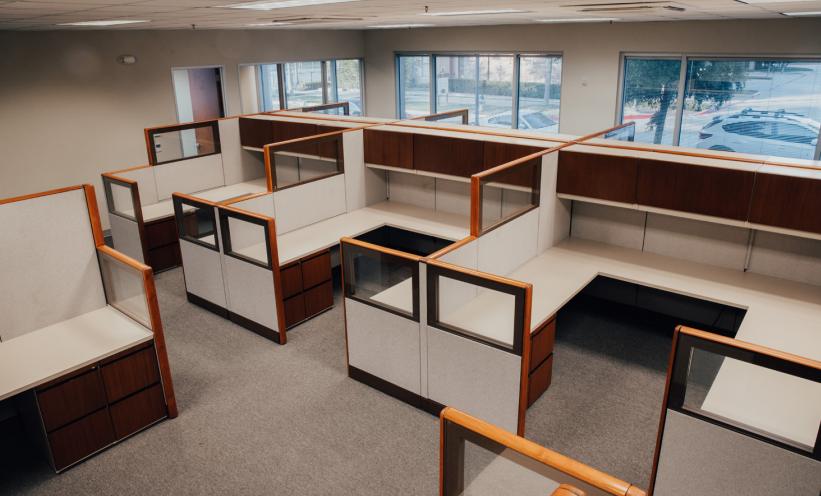
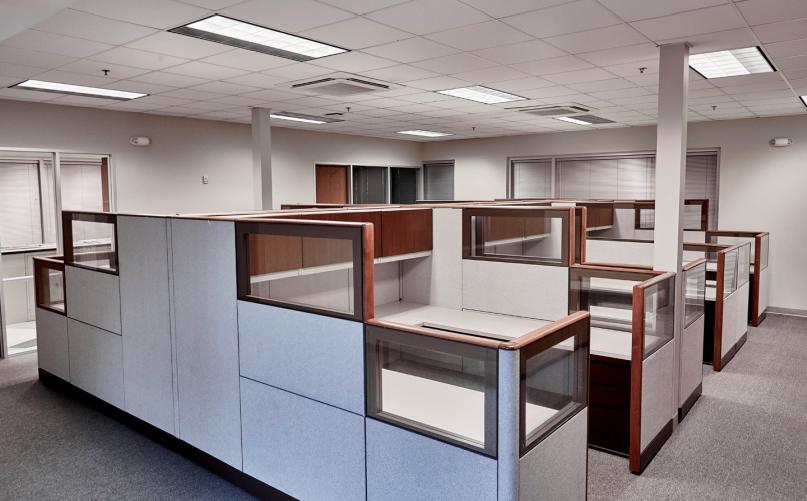
Office Space
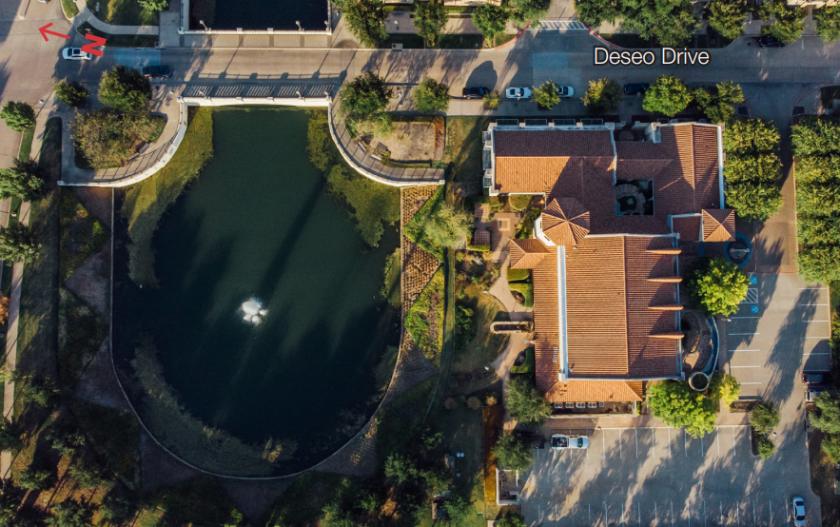
6655 Deseo Drive Irving, TX 75039
6655 Deseo Drive Irving, TX 75039
Details & Description
Property Highlights
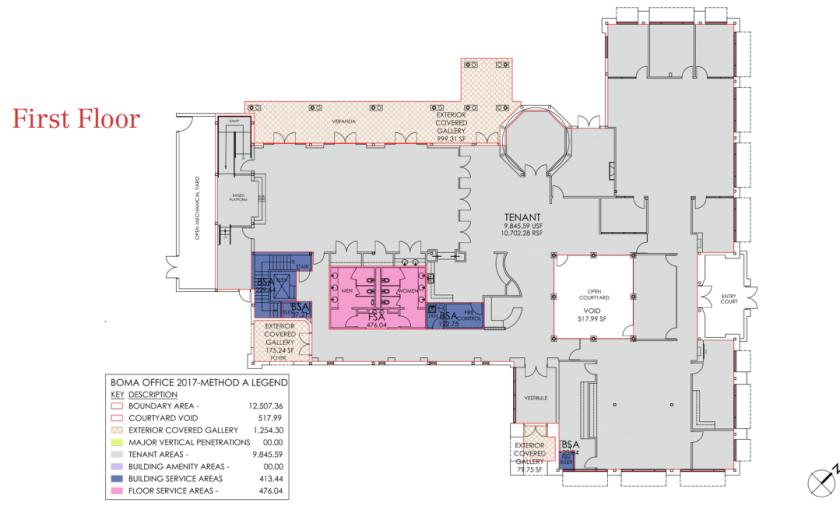
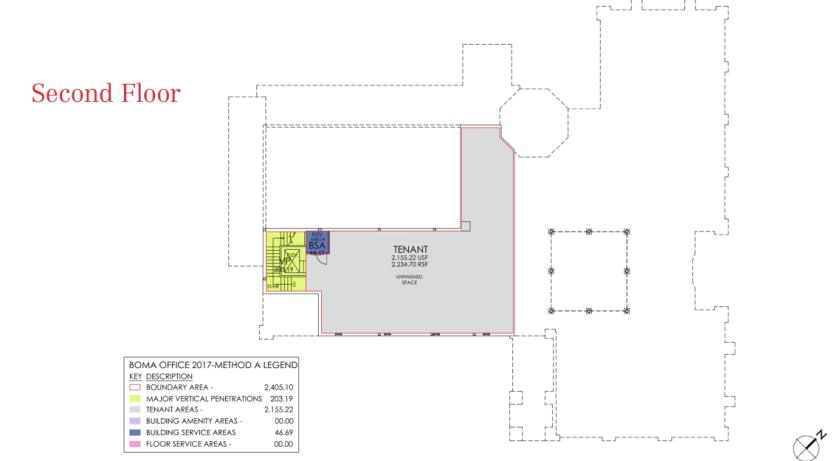
- • Unique Single-Tenant Office Building For Lease
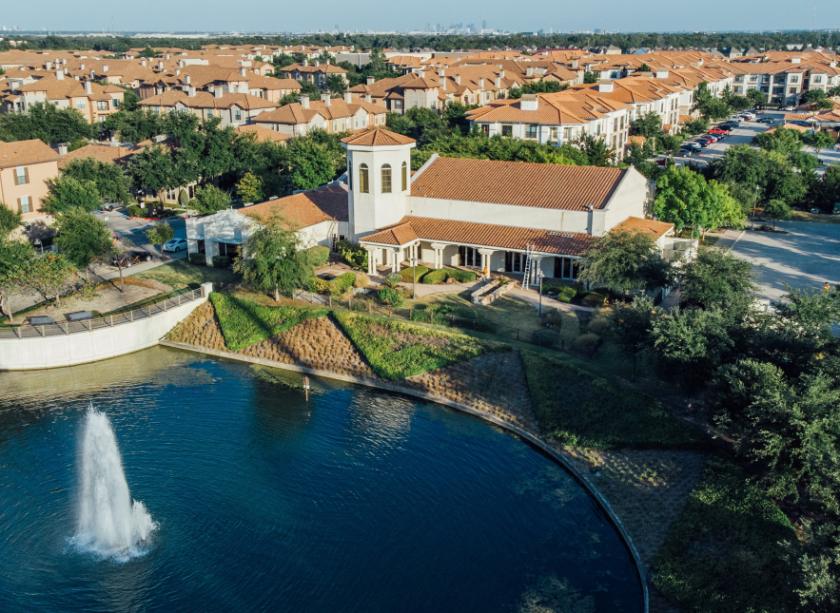
- • Close Proximity to Las Colinas and DFW Airport
- • Outdoor Garden at Entry Courtyard Overlooks Pond
Additional Photos
Listing Agents

Zach Stevens
O: 214-256-7149
M: 214-918-0330
zstevens@nairl.com
O: 214-256-7149
M: 214-918-0330
zstevens@nairl.com

Everett James
O: 214-256-7170
M: 214-904-9166
ejames@nairl.com
O: 214-256-7170
M: 214-904-9166
ejames@nairl.com
While we strive to provide the most accurate information, all listing information, and demographic data, is provided by third-parties. As such, MyEListing will not be responsible for the accuracy of the information. It is strongly recommended that you verify all information with the listing agent, and any relevant agencies, prior to making any decisions.