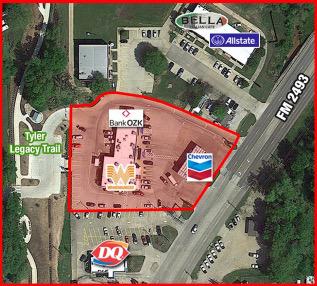
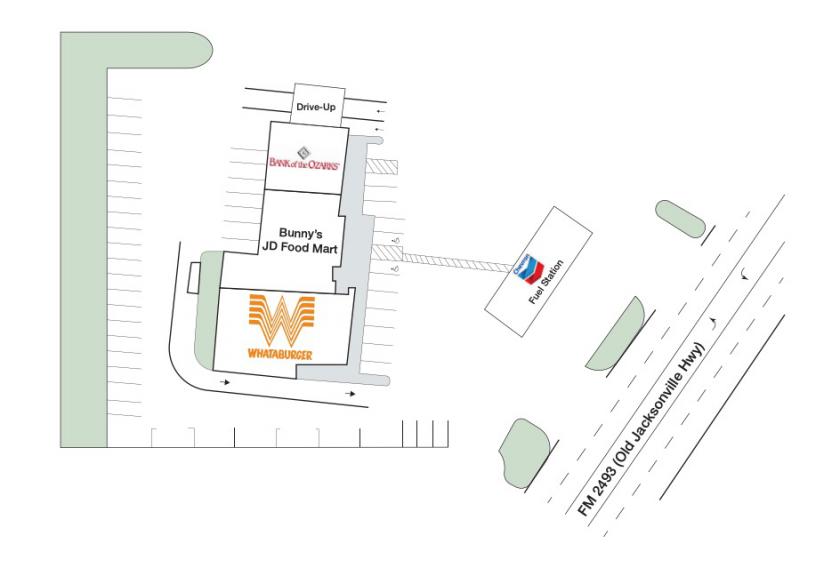
1-Mile | 3-Miles | 5-Miles | ||
---|---|---|---|---|
Total Population | 1,578 | 12,171 | 39,749 | |
Population Median Age | 39 | 39 | 39 | |
Population by Age | 0-9 Yrs | 212 (13%) | 1738 (14%) | 5128 (12%) |
10-19 Yrs | 201 (12%) | 1447 (11%) | 5052 (12%) | |
20-29 Yrs | 180 (11%) | 1292 (10%) | 5380 (13%) | |
30-39 Yrs | 209 (13%) | 1607 (13%) | 4991 (12%) | |
40-49 Yrs | 201 (12%) | 1508 (12%) | 4693 (11%) | |
50-59 Yrs | 172 (10%) | 1563 (12%) | 4929 (12%) | |
60-69 Yrs | 254 (16%) | 1797 (14%) | 4575 (11%) | |
70+ Yrs | 149 (9%) | 1219 (10%) | 5002 (12%) | |
Median HH Income | $95,519 | $89,067 | $68,280 | |
Total Household Income | < 24K | 51 (8%) | 441 (9%) | 2347 (14%) |
25-49K | 109 (17%) | 883 (18%) | 3677 (23%) | |
50-74K | 66 (10%) | 619 (12%) | 2398 (15%) | |
75-99K | 102 (16%) | 808 (16%) | 2133 (13%) | |
100-199K | 233 (37%) | 1550 (32%) | 3753 (23%) | |
200K+ | 58 (9%) | 494 (10%) | 1430 (9%) | |
Highest Education Level | No Diploma | 42 | 331 | 1338 |
Diploma or GED | 128 | 1238 | 4420 | |
Some College | 295 | 2282 | 7024 | |
Assoc. Degree | 70 | 773 | 3219 | |
Bachelors Degree | 319 | 2257 | 6964 | |
Higher Degree | 246 | 1642 | 4000 | |
Total Housing Units | 702 | 5,331 | 17,438 | |
--Owner-Occupied | 474 | 3,602 | 9,935 | |
--Renter-Occupied | 145 | 1,193 | 5,802 | |
Owner-Occupied Values | < 100K | 44 | 337 | 963 |
100-199K | 116 | 1059 | 3786 | |
200-299K | 97 | 873 | 2437 | |
300-399K | 113 | 655 | 1321 | |
400-499K | 31 | 225 | 578 | |
500K+ | 73 | 453 | 849 | |
Total Working Age Population | 1,228 | 9,449 | 31,427 | |
In Work Force | 827 | 6,335 | 20,316 | |
Not In Work Force | 401 | 3,114 | 11,111 | |
Workforce Employed | 790 | 6,041 | 19,409 | |
Workforce Unemployed | 37 | 294 | 895 | |
Civlian Workforce | 827 | 6,335 | 20,304 | |
Military Workforce | 0 | 0 | 12 | |
Total Households | 619 | 4,795 | 15,737 | |
Family Households | 488 | 3,642 | 10,345 | |
Non-Family Households | 131 | 1,153 | 5,392 | |
Married Couple | 406 | 3,105 | 8,530 | |
Other Family | 82 | 537 | 1,815 | |
Married w/Child | 163 | 1,203 | 3,163 | |
Single Male w/Child | 11 | 85 | 278 | |
Single Female w/Child | 40 | 229 | 801 |
Population Change Last Two Decades - Plus Projection
2000 | % | 2010 | % | 2020 | % | 2030 | |
---|---|---|---|---|---|---|---|
Texas | 20,851,820 | +21 | 25,145,561 | +18 | 29,677,668 | +18 | 34,894,452 |
Smith County | 174,706 | +20 | 209,714 | +12 | 235,143 | +10 | 257,573 |
Total Working Age Population:
Total Households:
Total Working Age Population:
Total Households:
Total Working Age Population:
Total Households: