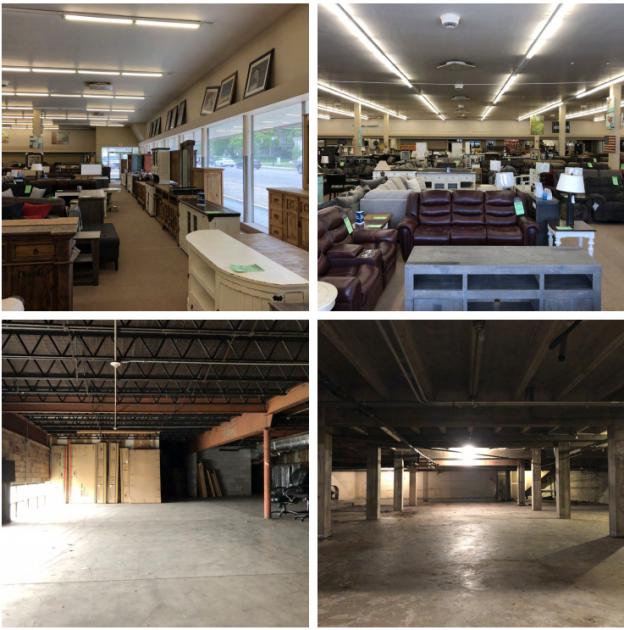
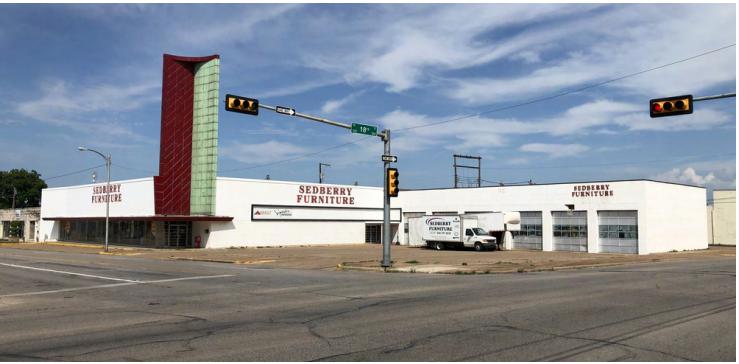
Industrial Properties
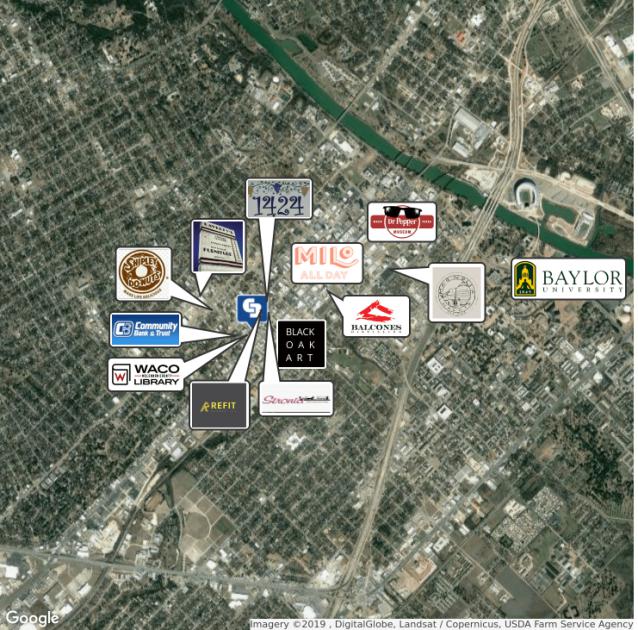
1726 Austin Ave Waco, TX 76701
1726 Austin Ave Waco, TX 76701
Details & Description
Listing Agents

Josh Carter
O: 254-776-0000
M: 254-744-5777
joshcarter@jsrwaco.com
O: 254-776-0000
M: 254-744-5777
joshcarter@jsrwaco.com
While we strive to provide the most accurate information, all listing information, and demographic data, is provided by third-parties. As such, MyEListing will not be responsible for the accuracy of the information. It is strongly recommended that you verify all information with the listing agent, and any relevant agencies, prior to making any decisions.