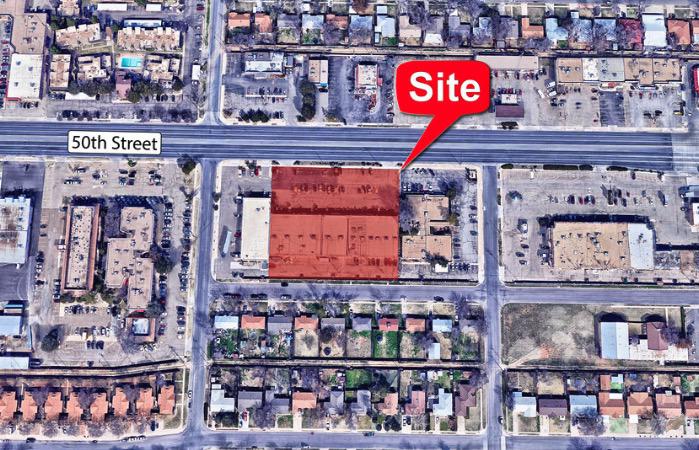
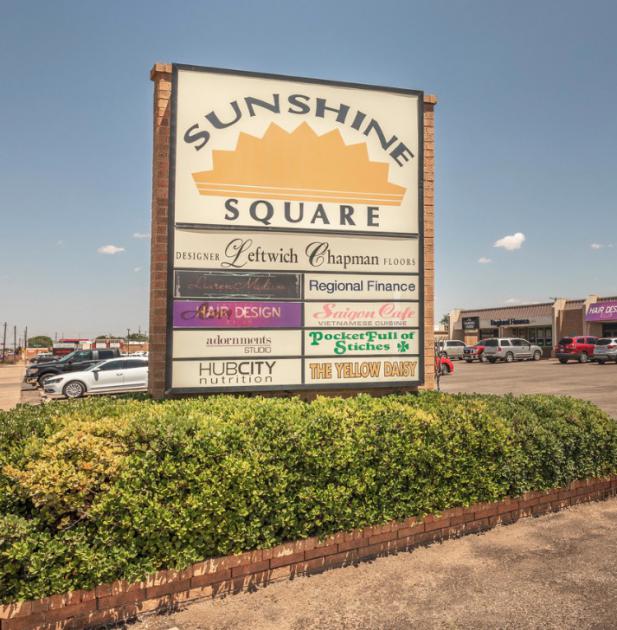
1-Mile | 3-Miles | 5-Miles | ||
---|---|---|---|---|
Total Population | 16,458 | 114,070 | 223,130 | |
Population Median Age | 35 | 36 | 34 | |
Population by Age | 0-9 Yrs | 2828 (17%) | 13381 (11%) | 28148 (12%) |
10-19 Yrs | 1829 (11%) | 16499 (14%) | 33695 (15%) | |
20-29 Yrs | 3130 (19%) | 25580 (22%) | 51707 (23%) | |
30-39 Yrs | 2572 (15%) | 13653 (11%) | 28805 (12%) | |
40-49 Yrs | 1553 (9%) | 10167 (8%) | 21376 (9%) | |
50-59 Yrs | 1530 (9%) | 12079 (10%) | 23086 (10%) | |
60-69 Yrs | 1375 (8%) | 10690 (9%) | 18256 (8%) | |
70+ Yrs | 1642 (9%) | 12021 (10%) | 18056 (8%) | |
Median HH Income | $49,496 | $49,385 | $48,833 | |
Total Household Income | < 24K | 1157 (18%) | 10564 (23%) | 21695 (25%) |
25-49K | 2106 (32%) | 12532 (27%) | 21948 (25%) | |
50-74K | 1323 (20%) | 8308 (18%) | 14865 (17%) | |
75-99K | 746 (11%) | 5139 (11%) | 10100 (11%) | |
100-199K | 931 (14%) | 7134 (15%) | 13247 (15%) | |
200K+ | 138 (2%) | 1881 (4%) | 3402 (3%) | |
Highest Education Level | No Diploma | 1273 | 7328 | 16895 |
Diploma or GED | 2530 | 16081 | 31742 | |
Some College | 2710 | 17119 | 31530 | |
Assoc. Degree | 571 | 4397 | 7991 | |
Bachelors Degree | 1791 | 13798 | 25110 | |
Higher Degree | 1264 | 9247 | 15155 | |
Total Housing Units | 6,871 | 50,209 | 95,202 | |
--Owner-Occupied | 3,790 | 23,555 | 43,140 | |
--Renter-Occupied | 2,612 | 22,003 | 42,117 | |
Owner-Occupied Values | < 100K | 1562 | 6532 | 13537 |
100-199K | 1962 | 11419 | 19173 | |
200-299K | 166 | 3150 | 5763 | |
300-399K | 50 | 1293 | 2323 | |
400-499K | 42 | 533 | 1110 | |
500K+ | 8 | 627 | 1234 | |
Total Working Age Population | 12,487 | 92,143 | 178,112 | |
In Work Force | 8,847 | 60,513 | 117,528 | |
Not In Work Force | 3,640 | 31,630 | 60,584 | |
Workforce Employed | 8,681 | 58,039 | 112,564 | |
Workforce Unemployed | 164 | 2,411 | 4,810 | |
Civlian Workforce | 8,845 | 60,450 | 117,374 | |
Military Workforce | 3 | 63 | 153 | |
Total Households | 6,402 | 45,558 | 85,257 | |
Family Households | 4,121 | 26,383 | 50,475 | |
Non-Family Households | 2,280 | 19,175 | 34,782 | |
Married Couple | 2,750 | 18,440 | 34,375 | |
Other Family | 1,371 | 7,943 | 16,100 | |
Married w/Child | 1,194 | 6,712 | 13,914 | |
Single Male w/Child | 308 | 1,194 | 2,332 | |
Single Female w/Child | 636 | 3,239 | 6,206 |
Population Change Last Two Decades - Plus Projection
2000 | % | 2010 | % | 2020 | % | 2030 | |
---|---|---|---|---|---|---|---|
Texas | 20,851,820 | +21 | 25,145,561 | +18 | 29,677,668 | +18 | 34,894,452 |
Lubbock County | 242,628 | +15 | 278,831 | +14 | 317,210 | +16 | 367,552 |
Total Working Age Population:
Total Households:
Total Working Age Population:
Total Households:
Total Working Age Population:
Total Households: