Highlights
37,000 students
14,500 students live within 3 blocks
7,000 students live on campus
an additional 5,000 students live within 2 miles
40,00 students projected by 2020
Excellent foot traffic
High disposable income area
Description
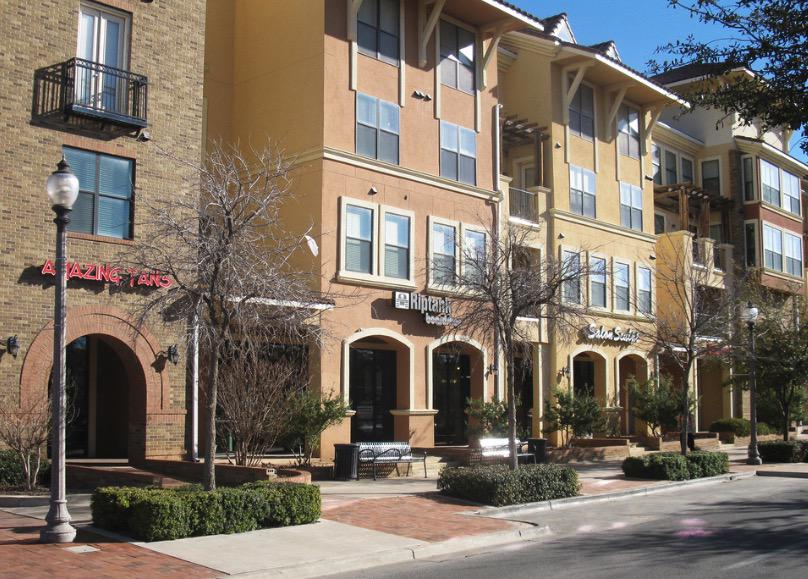
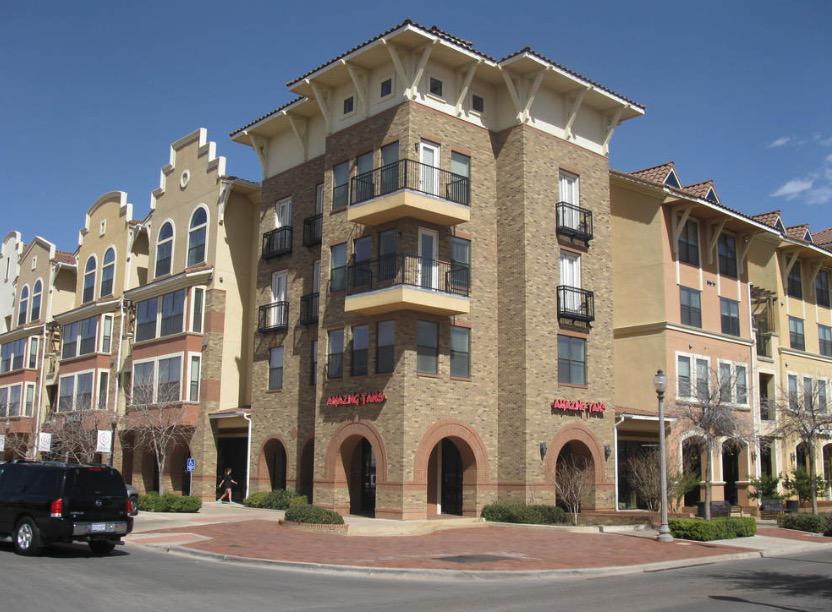
THE CENTRE’ AT OVERTON PARK, is an urban mixed use property
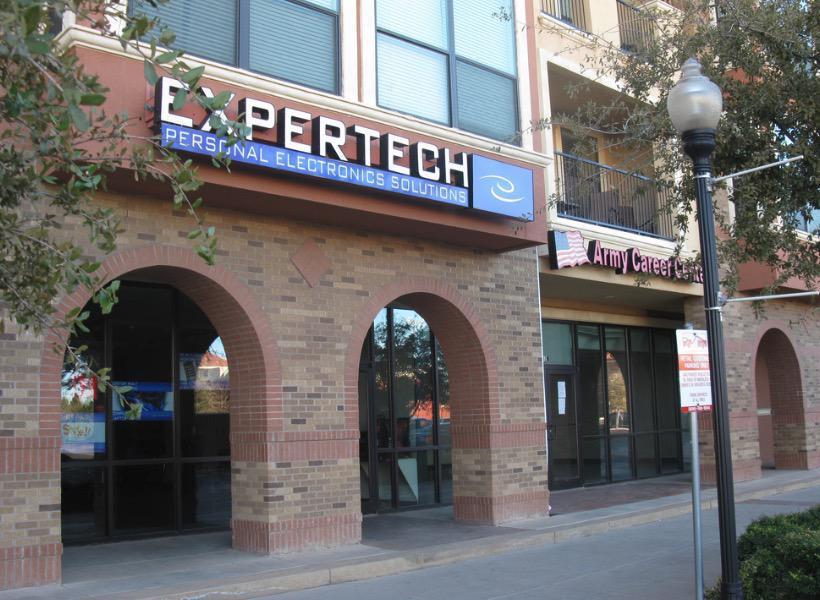
which includes 278 apartment units and 10 ground-level retail units. The property
was built in 2004 and is located just north of Glenna Goodacre Blvd. and just east
of University Ave. and across from Texas Tech University. The ground-level retail
units face University Ave. The traffic count, as of 2012, was over 106,450 vehicles
per day at the combined intersections of Glenna Goodacre, University Ave., and
the Marsha Sharp Freeway. Being right across from the Texas Tech University campus,
The Centre’ has excellent foot traffic. The Overton area has abundant student
housing with over 14,500 students within three blocks (counting those currently in
planning). The students in the Overton Area come from affluent families and have
high disposable income. The United Spirit Arena has 15,000 seats and has events
throughout the year including men’s and women’s basketball, volleyball, and concerts.
Jones AT&T stadium, with a 60,000 seat capacity, is located directly across
from The Centre’ at Overton Park. Texas Tech University is part of the Big 12 Conference
and is home to over 36,000 students. Texas Tech is moving towards Tier 1 status
and continues to rapidly grow each year. The Texas Tech chancellor and regents
are publicly committed to growing Texas Tech to over 40,000 students by 2020.
The Centre at Overton Park is located on University Avenue directly across from Texas Tech University. The property faces west towards the campus and strong retailers such as Chili's and AT&T sit in front of the site.