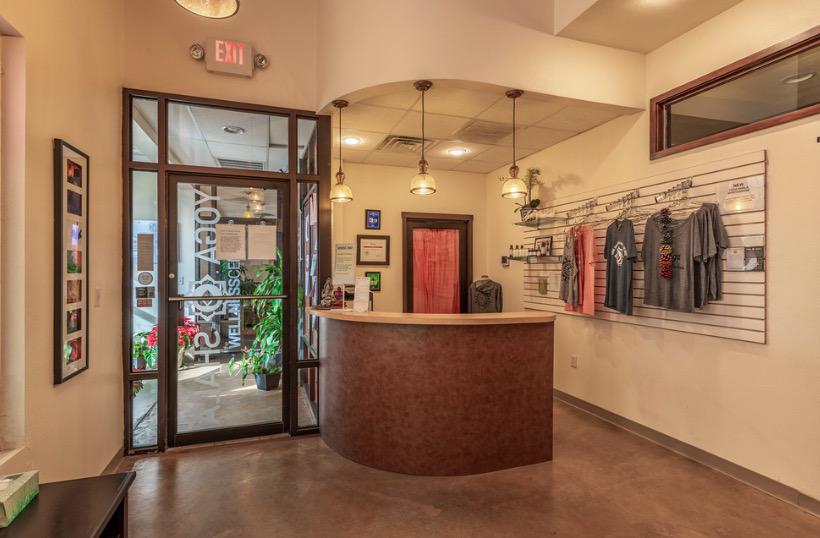
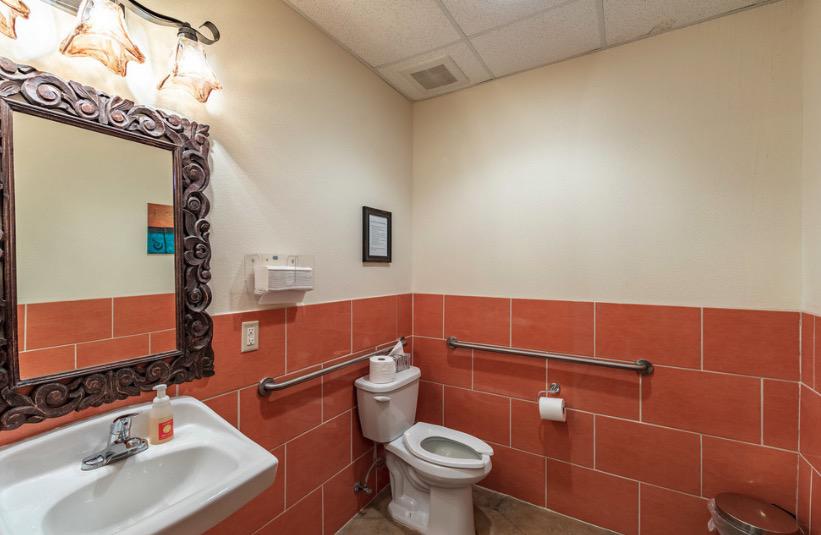
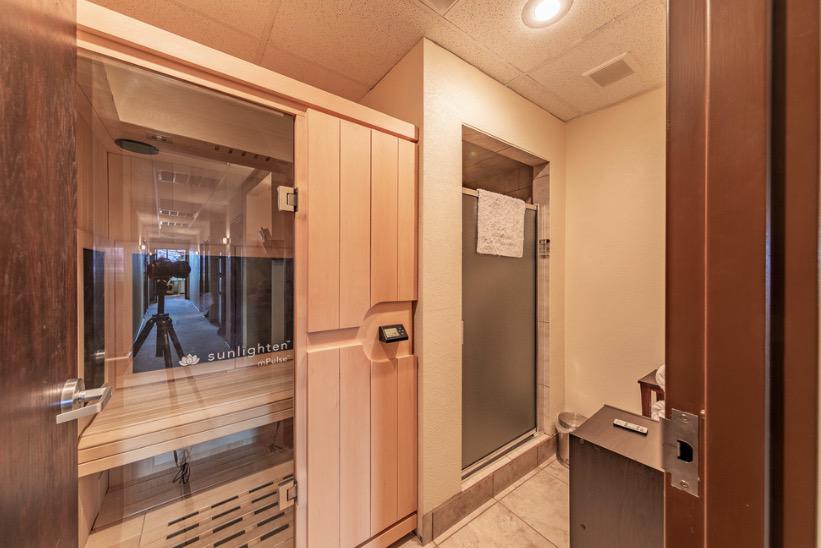
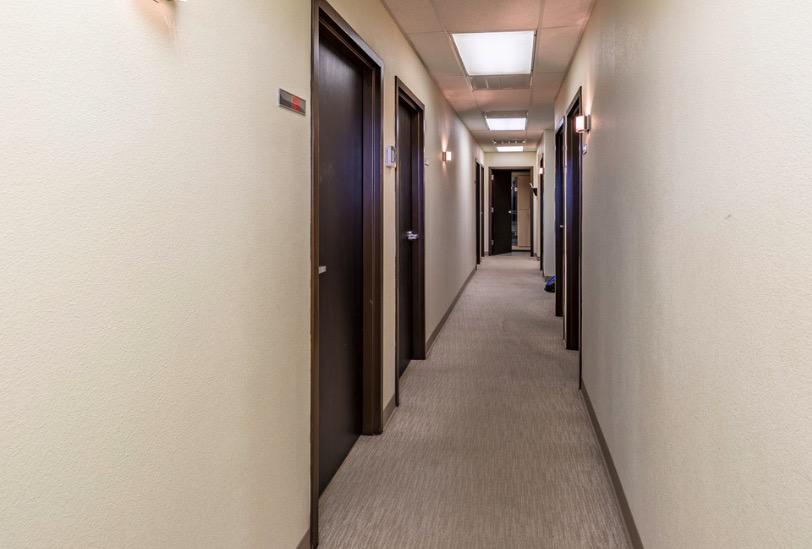
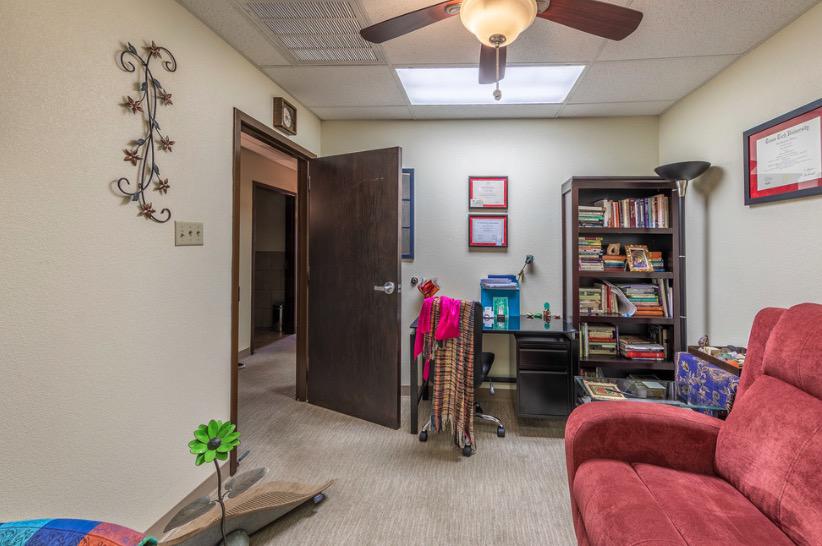
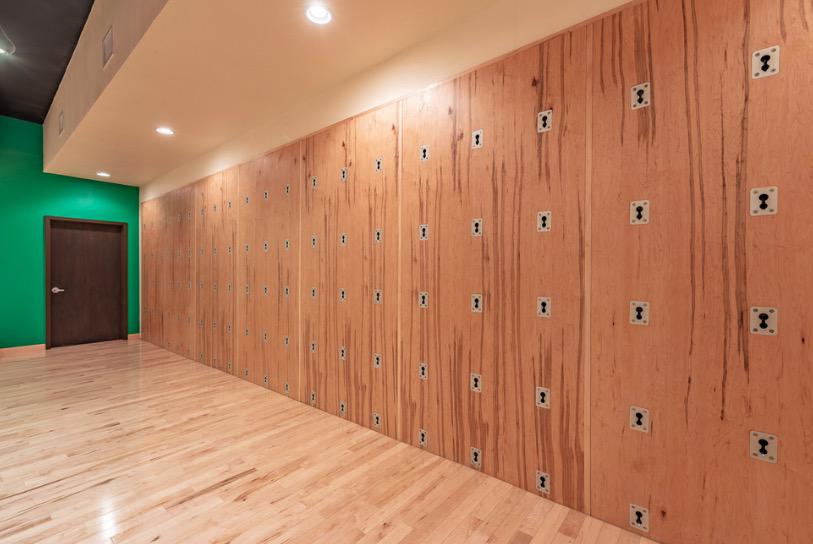
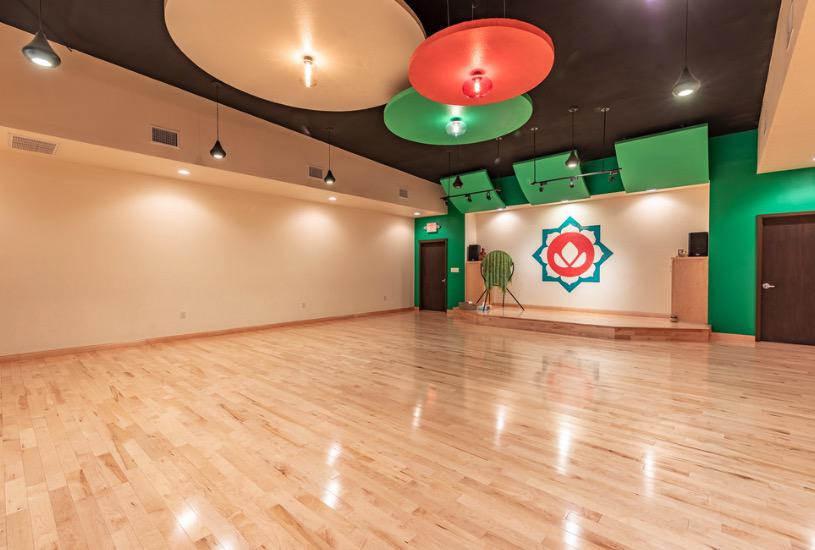
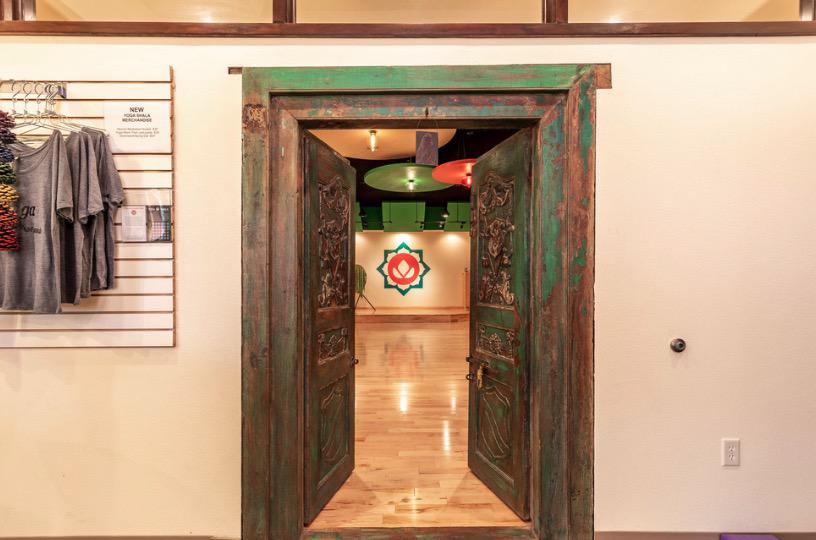
Highlights Excellent location within Central Lubbock 19,576 vehicles per day Property is in great condition and is well-maintained 18 parking spaces Business, furniture, fixtures, and equipment can be purchased with real estate (ask broker for more details)DescriptionColdwell Banker Commercial, Capital Advisors is pleased to offer for sale an office/retail property located at 4410 50th Street in Lubbock, TX. The subject property has 4,221 square feet (per LCAD) and completed quality renovations in 2013. The building has been very well-maintained by the owner and can provide a user/investor with multiple opportunities. Everything about the building is up to city code per the owner. The subject property includes a fully equipped workout studio with fitness wall equipment installed, 8 offices, 4 restrooms (ADA compliant), 2 reception/waiting areas, sauna room, storage room, and shop room. Certain furniture and equipment items can be purchased with the real estate. The current exercise studio has a built-in sound system and mixing board equipped with acoustic sound panels. There is also solid brick wall barriers separating the space from the east/west neighboring users to prevent any sound nuisance. The fitness wall equipment can give users multiple forms of exercise opportunities such as yoga, barre and pilates. There are only a few studios in Texas that have this type of wall equipment. The 2 reception/waiting areas for the offices on the west side of the building and the exercise studio on the east side have ample space for couches and seating. The shop room by the entrance can be used for a retail store and/or main reception desk area. The subject property is located in central Lubbock, TX. The property provides great frontage and visibility along the highly trafficked 50th Street. Lubbock, TX is home to Texas Tech University, Texas Tech Health Sciences Center, Lubbock Christian University, and South Plains College.