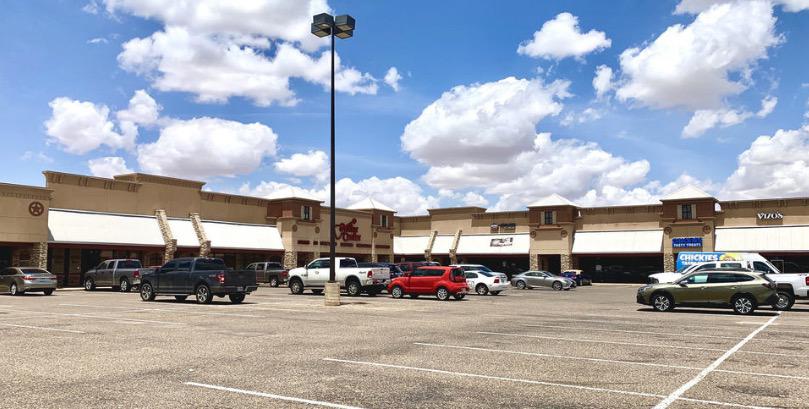
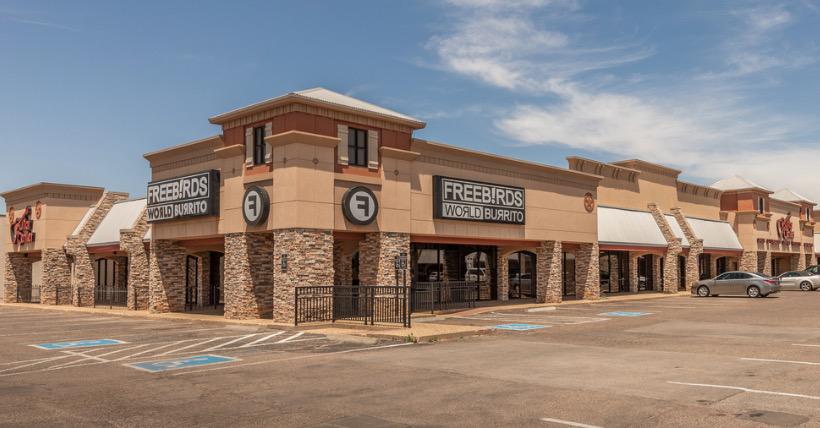
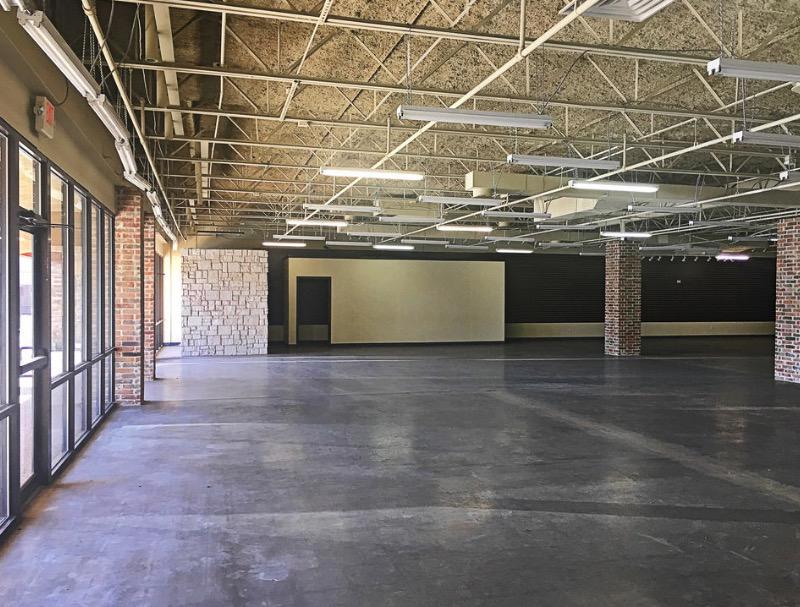
1-Mile | 3-Miles | 5-Miles | ||
---|---|---|---|---|
Total Population | 14,252 | 100,550 | 212,611 | |
Population Median Age | 37 | 37 | 34 | |
Population by Age | 0-9 Yrs | 1974 (13%) | 12993 (12%) | 27007 (12%) |
10-19 Yrs | 1156 (8%) | 12425 (12%) | 32208 (15%) | |
20-29 Yrs | 3574 (25%) | 19199 (19%) | 49323 (23%) | |
30-39 Yrs | 1880 (13%) | 13095 (13%) | 27355 (12%) | |
40-49 Yrs | 1290 (9%) | 10005 (9%) | 20501 (9%) | |
50-59 Yrs | 1238 (8%) | 11424 (11%) | 21741 (10%) | |
60-69 Yrs | 1368 (9%) | 10330 (10%) | 17466 (8%) | |
70+ Yrs | 1773 (12%) | 11078 (11%) | 17010 (8%) | |
Median HH Income | $50,262 | $55,136 | $50,196 | |
Total Household Income | < 24K | 1463 (21%) | 8167 (19%) | 19727 (24%) |
25-49K | 1888 (28%) | 10783 (25%) | 20797 (25%) | |
50-74K | 1359 (20%) | 7378 (17%) | 14162 (17%) | |
75-99K | 716 (10%) | 5046 (12%) | 9896 (12%) | |
100-199K | 1141 (16%) | 7836 (18%) | 13210 (16%) | |
200K+ | 170 (2%) | 2290 (5%) | 3522 (4%) | |
Highest Education Level | No Diploma | 765 | 5627 | 14651 |
Diploma or GED | 1857 | 14335 | 29460 | |
Some College | 2696 | 16545 | 30134 | |
Assoc. Degree | 614 | 4193 | 7808 | |
Bachelors Degree | 1980 | 14508 | 25088 | |
Higher Degree | 1344 | 8762 | 14941 | |
Total Housing Units | 7,538 | 45,234 | 90,143 | |
--Owner-Occupied | 2,838 | 23,555 | 41,998 | |
--Renter-Occupied | 3,897 | 17,945 | 39,316 | |
Owner-Occupied Values | < 100K | 377 | 4952 | 11957 |
100-199K | 2045 | 11446 | 19213 | |
200-299K | 262 | 4061 | 5955 | |
300-399K | 121 | 1633 | 2433 | |
400-499K | 6 | 635 | 1162 | |
500K+ | 27 | 828 | 1278 | |
Total Working Age Population | 11,620 | 79,473 | 169,301 | |
In Work Force | 8,306 | 54,055 | 112,431 | |
Not In Work Force | 3,314 | 25,418 | 56,870 | |
Workforce Employed | 7,946 | 52,205 | 107,755 | |
Workforce Unemployed | 349 | 1,775 | 4,523 | |
Civlian Workforce | 8,296 | 53,980 | 112,278 | |
Military Workforce | 11 | 76 | 154 | |
Total Households | 6,736 | 41,500 | 81,314 | |
Family Households | 3,428 | 25,278 | 48,226 | |
Non-Family Households | 3,308 | 16,222 | 33,087 | |
Married Couple | 2,392 | 18,388 | 33,261 | |
Other Family | 1,036 | 6,890 | 14,966 | |
Married w/Child | 950 | 6,921 | 13,630 | |
Single Male w/Child | 128 | 1,005 | 2,154 | |
Single Female w/Child | 511 | 2,946 | 5,714 |
Population Change Last Two Decades - Plus Projection
2000 | % | 2010 | % | 2020 | % | 2030 | |
---|---|---|---|---|---|---|---|
Texas | 20,851,820 | +21 | 25,145,561 | +18 | 29,677,668 | +18 | 34,894,452 |
Lubbock County | 242,628 | +15 | 278,831 | +14 | 317,210 | +16 | 367,552 |
Total Working Age Population:
Total Households:
Total Working Age Population:
Total Households:
Total Working Age Population:
Total Households: