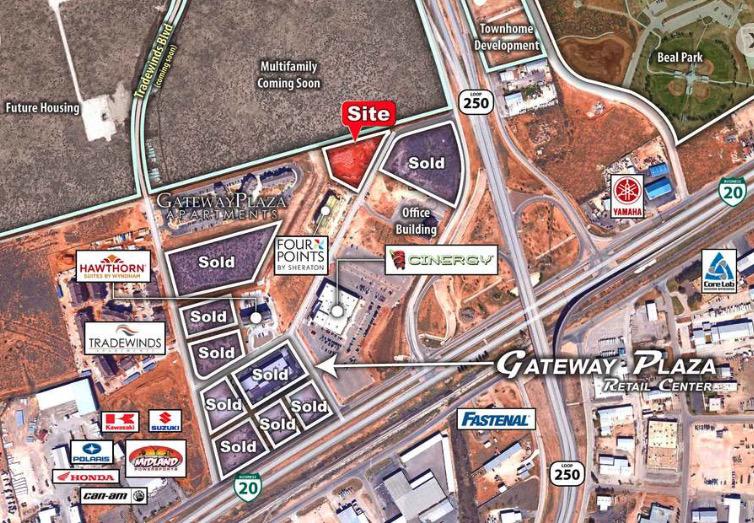
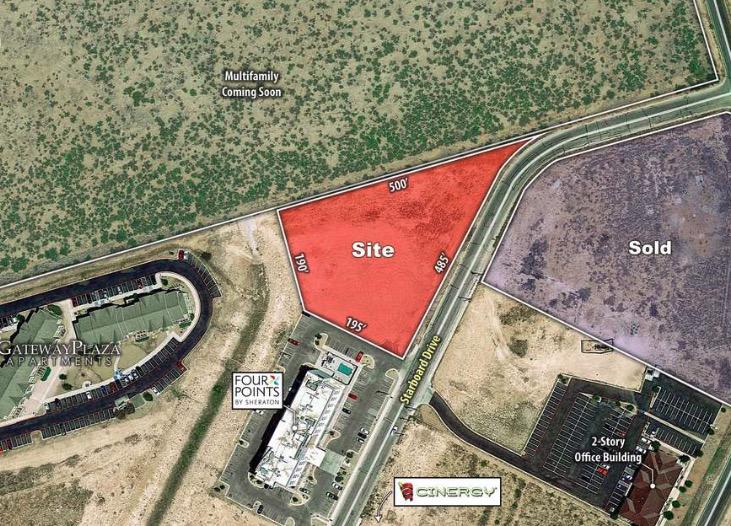
1-Mile | 3-Miles | 5-Miles | ||
---|---|---|---|---|
Total Population | 2,674 | 32,838 | 92,905 | |
Population Median Age | 33 | 33 | 34 | |
Population by Age | 0-9 Yrs | 397 (14%) | 5428 (16%) | 15314 (16%) |
10-19 Yrs | 415 (15%) | 4968 (15%) | 13293 (14%) | |
20-29 Yrs | 402 (15%) | 5766 (17%) | 15462 (16%) | |
30-39 Yrs | 499 (18%) | 4971 (15%) | 13712 (14%) | |
40-49 Yrs | 393 (14%) | 4125 (12%) | 11039 (11%) | |
50-59 Yrs | 273 (10%) | 3409 (10%) | 10215 (10%) | |
60-69 Yrs | 183 (6%) | 2416 (7%) | 7786 (8%) | |
70+ Yrs | 112 (4%) | 1754 (5%) | 6083 (6%) | |
Median HH Income | $86,733 | $73,597 | $79,626 | |
Total Household Income | < 24K | 94 (10%) | 1389 (12%) | 3879 (12%) |
25-49K | 107 (12%) | 2183 (20%) | 5894 (18%) | |
50-74K | 113 (13%) | 1970 (18%) | 5195 (16%) | |
75-99K | 253 (29%) | 1982 (18%) | 4893 (15%) | |
100-199K | 255 (29%) | 2776 (25%) | 8716 (27%) | |
200K+ | 43 (4%) | 565 (5%) | 3171 (9%) | |
Highest Education Level | No Diploma | 312 | 3841 | 9061 |
Diploma or GED | 541 | 6226 | 14416 | |
Some College | 361 | 4839 | 13119 | |
Assoc. Degree | 175 | 1928 | 4876 | |
Bachelors Degree | 181 | 2362 | 11550 | |
Higher Degree | 60 | 716 | 4389 | |
Total Housing Units | 909 | 11,604 | 33,897 | |
--Owner-Occupied | 647 | 7,461 | 21,438 | |
--Renter-Occupied | 216 | 3,403 | 10,311 | |
Owner-Occupied Values | < 100K | 120 | 1666 | 3853 |
100-199K | 355 | 4055 | 7602 | |
200-299K | 135 | 1257 | 5703 | |
300-399K | 27 | 295 | 2205 | |
400-499K | 0 | 72 | 973 | |
500K+ | 9 | 116 | 1101 | |
Total Working Age Population | 1,958 | 24,098 | 68,829 | |
In Work Force | 1,541 | 17,148 | 48,311 | |
Not In Work Force | 417 | 6,951 | 20,519 | |
Workforce Employed | 1,512 | 16,634 | 46,700 | |
Workforce Unemployed | 28 | 507 | 1,601 | |
Civlian Workforce | 1,540 | 17,141 | 48,301 | |
Military Workforce | 0 | 7 | 10 | |
Total Households | 863 | 10,865 | 31,749 | |
Family Households | 654 | 7,834 | 22,098 | |
Non-Family Households | 209 | 3,031 | 9,651 | |
Married Couple | 489 | 5,418 | 16,524 | |
Other Family | 165 | 2,416 | 5,574 | |
Married w/Child | 220 | 2,695 | 7,705 | |
Single Male w/Child | 45 | 310 | 675 | |
Single Female w/Child | 64 | 1,039 | 2,664 |
Population Change Last Two Decades - Plus Projection
2000 | % | 2010 | % | 2020 | % | 2030 | |
---|---|---|---|---|---|---|---|
Texas | 20,851,820 | +21 | 25,145,561 | +18 | 29,677,668 | +18 | 34,894,452 |
Midland County | 116,009 | +18 | 136,872 | +37 | 187,364 | +43 | 268,123 |
Total Working Age Population:
Total Households:
Total Working Age Population:
Total Households:
Total Working Age Population:
Total Households: