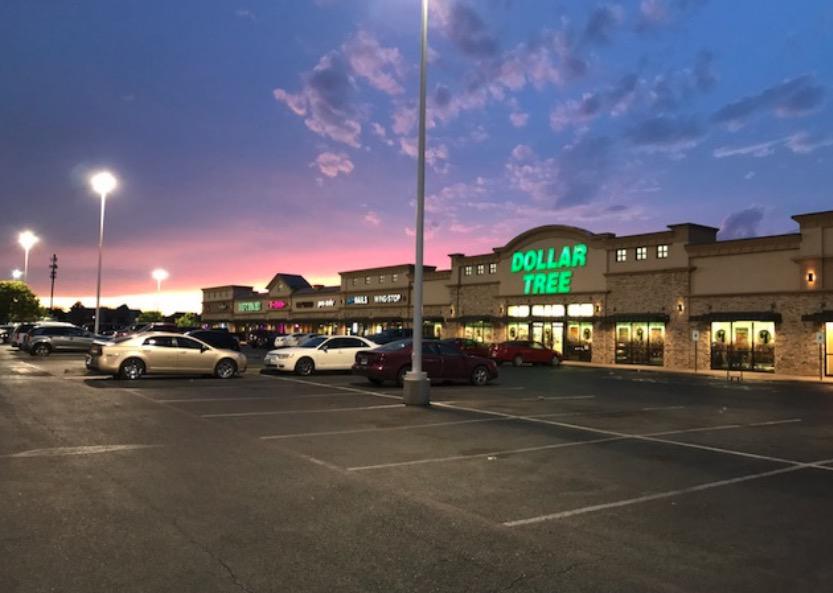
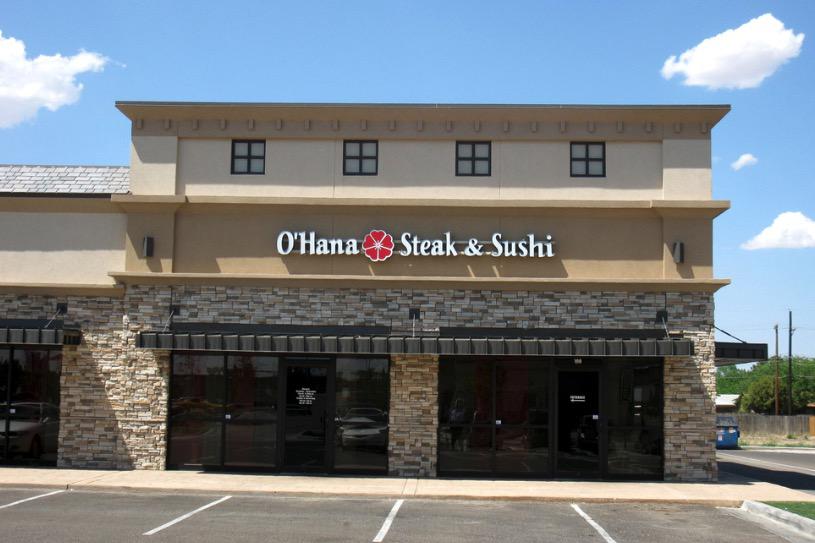
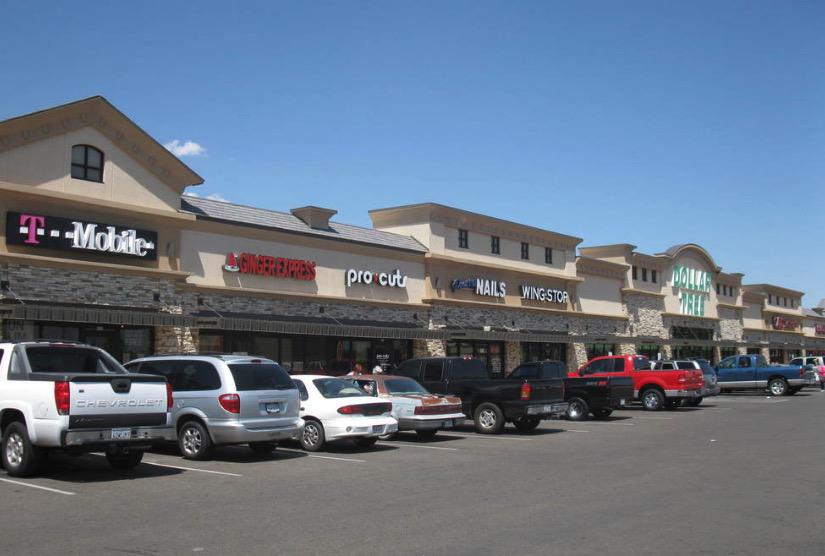
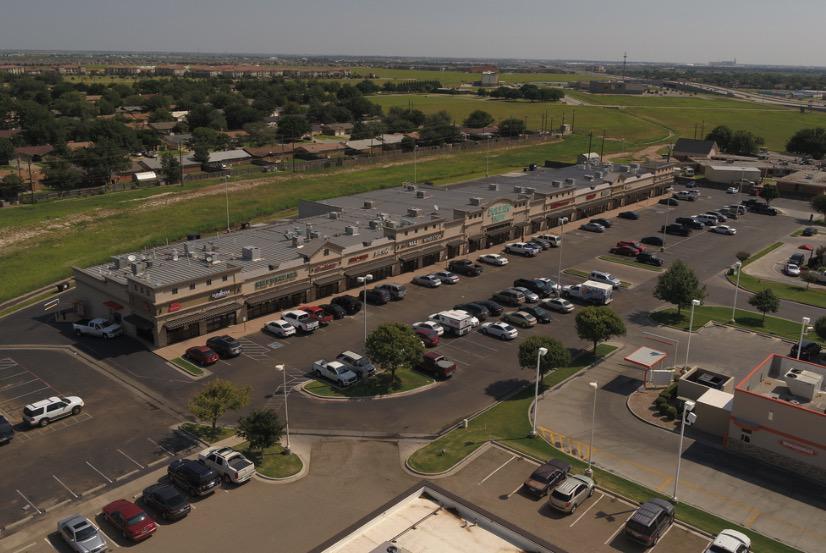
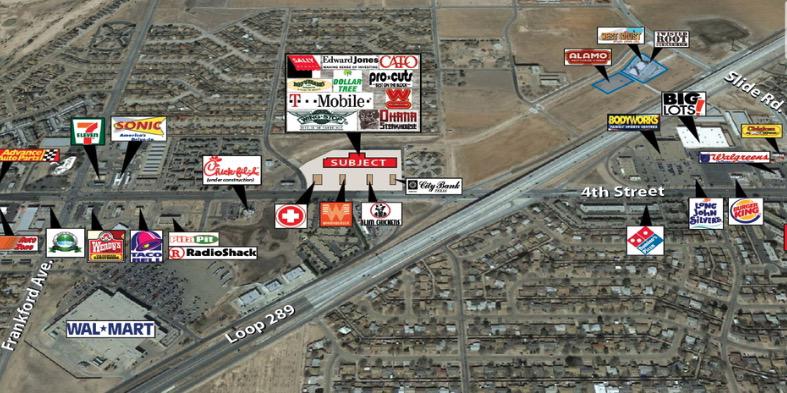
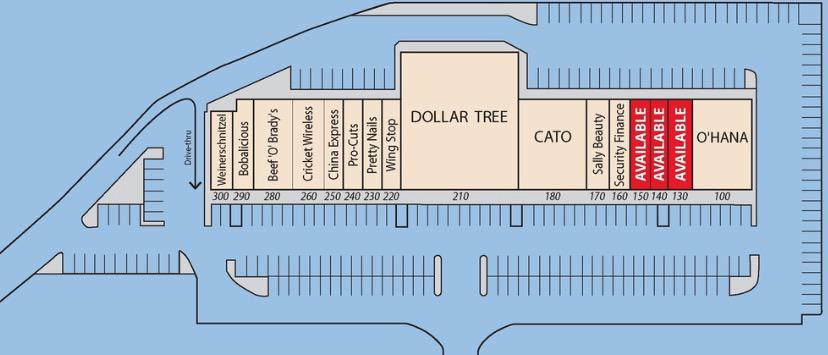
Highlights High Traffic Center Located at 4th Street and West Loop 289; Minutes Away from Texas Tech University, CBD In Close Proximity to Walmart, a recently-opened Chick-Fil-a and newly-opened Raising Cane's 56,140 vehicles per day through 4th Street & West Loop 289 (East-West) Co-Tenants include Dollar Tree, CATO, Weinerschnitzel, Beef O'Bradys, O'Hana, Sally Beauty, Wing Stop, & Pro-Cuts Abundant ParkingDescriptionWest Wind Shopping Center is a quality shopping center constructed in 2005 on 4th Street just outside West Loop 289, with high-traffic co-tenants, abundant parking, and space well suited for any retail business. Tenants at the center include Weinerschnitzel, Beef O'Brady's, ProCuts, Sally Beauty, Edward Jones, Wing Stop, Dollar Tree, CATO & O'Hana Japanese Steakhouse. Outlots at the center include City Bank, Whataburger, Slim Chickens and a medical clinic.The property is located in northwest Lubbock, conveniently located right off Loop 289, and fronts 4th Street in close proximity to Walmart. Convenient to downtown Lubbock, Texas Tech University and Lubbock Christian University via 4th Street, North Loop 289 and West Loop 289, the area is growing with many new businesses. Alamo Drafthouse Cinema is approximately 1/2 mile to the northeast of the shopping center at North Loop 289 & Slide Road and Walmart, a recently-opened Chick-Fil-A on the south side of 4th Street across from the center and a newly-opened Raising Cane's Chicken Fingers to the west of the center.