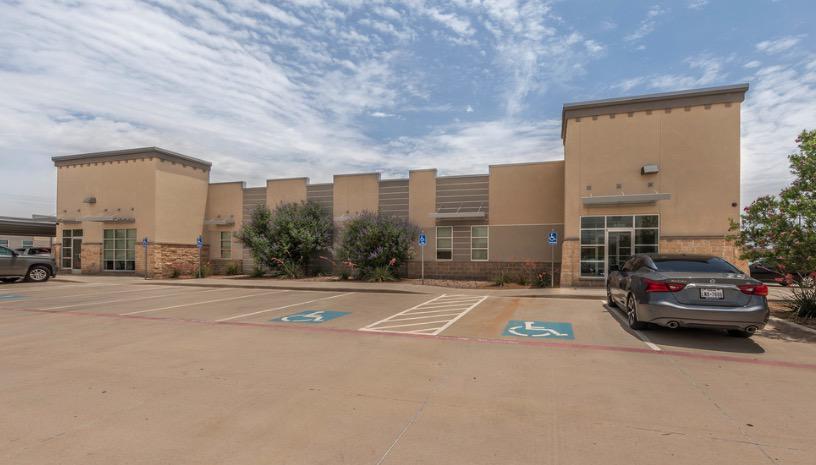
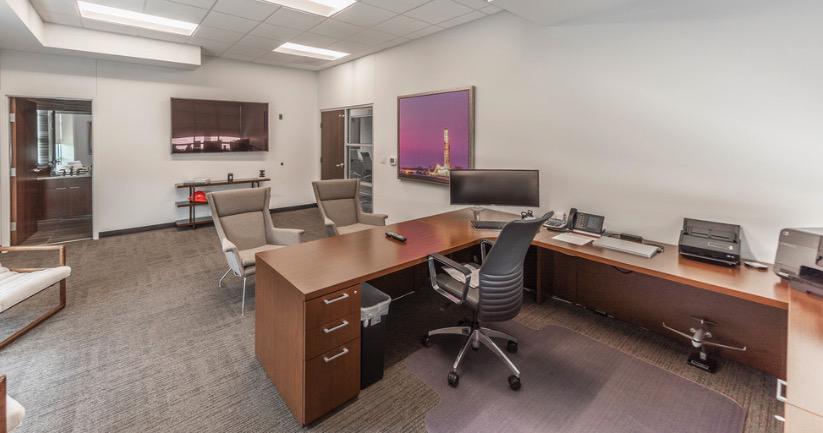
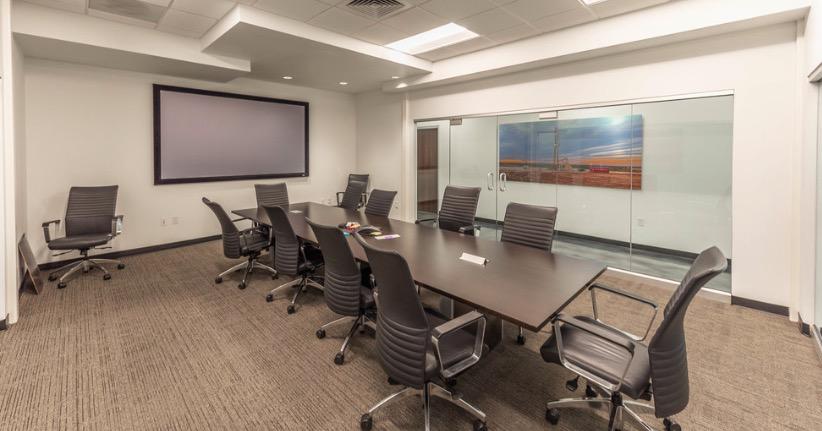
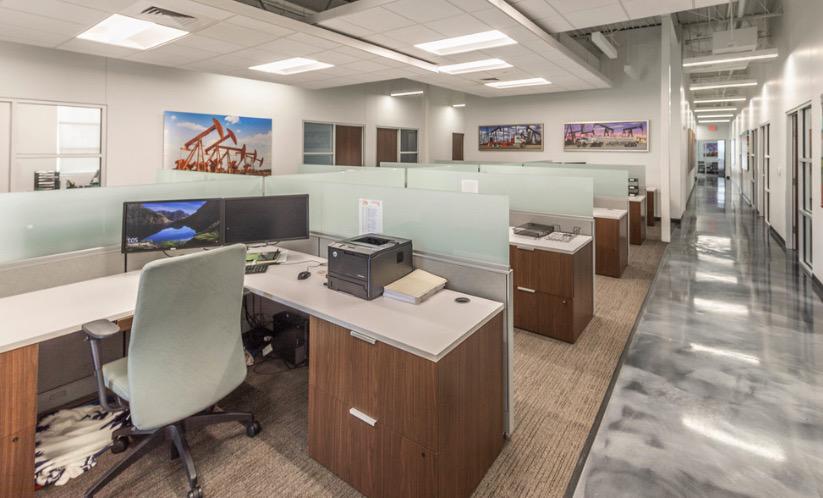
Office Space
6510 70th Street Lubbock, TX 79424
6510 70th Street Lubbock, TX 79424
Details & Description
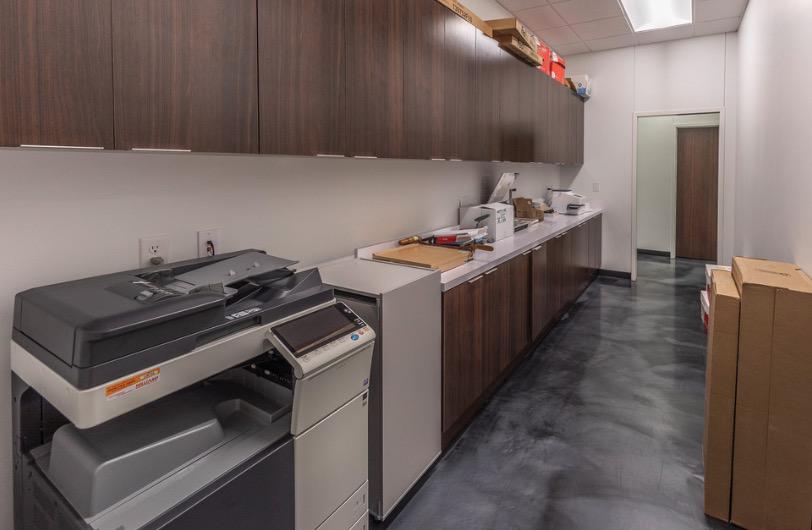
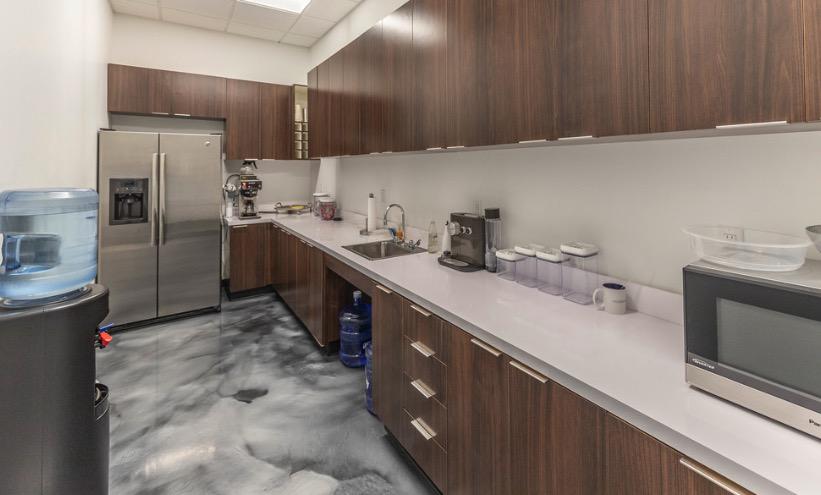
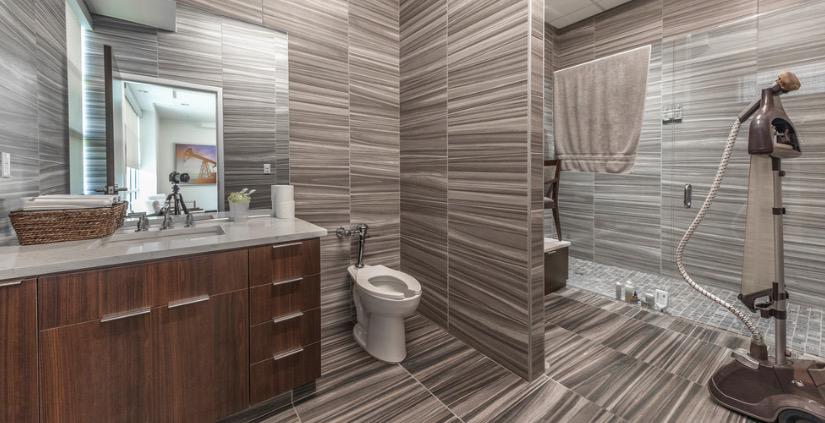
Additional Photos
Listing Agents

Scott Womack
M: 806-535-0888
swomack@coldwellbanker.com
M: 806-535-0888
swomack@coldwellbanker.com
While we strive to provide the most accurate information, all listing information, and demographic data, is provided by third-parties. As such, MyEListing will not be responsible for the accuracy of the information. It is strongly recommended that you verify all information with the listing agent, and any relevant agencies, prior to making any decisions.