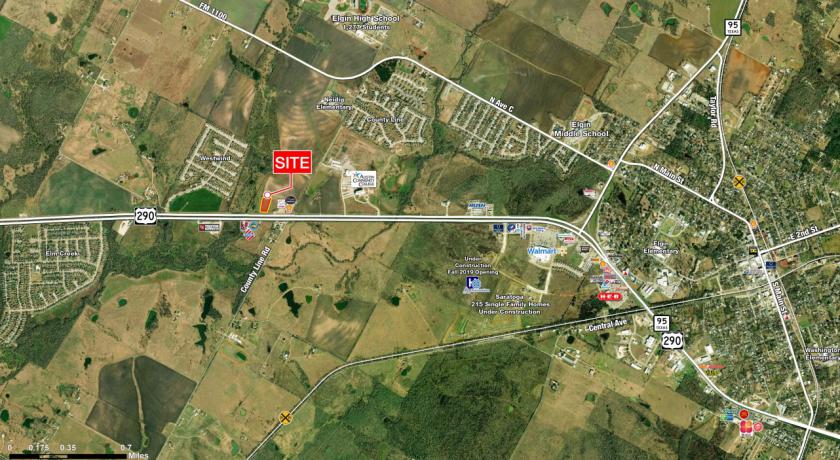
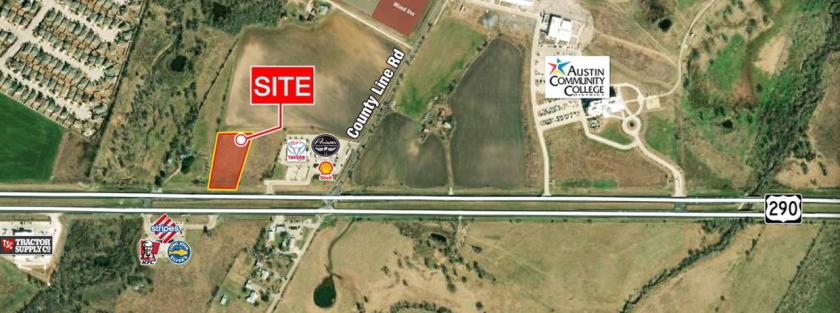
1-Mile | 3-Miles | 5-Miles | ||
---|---|---|---|---|
Total Population | 1,524 | 8,487 | 16,818 | |
Population Median Age | 34 | 34 | 34 | |
Population by Age | 0-9 Yrs | 243 (15%) | 1238 (14%) | 2603 (15%) |
10-19 Yrs | 325 (21%) | 1625 (19%) | 3071 (18%) | |
20-29 Yrs | 120 (7%) | 1079 (12%) | 2079 (12%) | |
30-39 Yrs | 248 (16%) | 1120 (13%) | 2279 (13%) | |
40-49 Yrs | 147 (9%) | 1031 (12%) | 2154 (12%) | |
50-59 Yrs | 169 (11%) | 1058 (12%) | 1898 (11%) | |
60-69 Yrs | 129 (8%) | 725 (8%) | 1537 (9%) | |
70+ Yrs | 141 (9%) | 611 (7%) | 1197 (7%) | |
Median HH Income | $58,972 | $62,711 | $59,529 | |
Total Household Income | < 24K | 77 (17%) | 353 (15%) | 812 (16%) |
25-49K | 115 (26%) | 607 (26%) | 1255 (26%) | |
50-74K | 69 (16%) | 457 (19%) | 1003 (20%) | |
75-99K | 62 (14%) | 344 (14%) | 702 (14%) | |
100-199K | 94 (21%) | 498 (21%) | 927 (19%) | |
200K+ | 11 (2%) | 66 (2%) | 110 (2%) | |
Highest Education Level | No Diploma | 137 | 1159 | 2515 |
Diploma or GED | 355 | 1700 | 3058 | |
Some College | 192 | 1226 | 2582 | |
Assoc. Degree | 67 | 275 | 517 | |
Bachelors Degree | 115 | 596 | 1215 | |
Higher Degree | 44 | 189 | 350 | |
Total Housing Units | 440 | 2,480 | 5,314 | |
--Owner-Occupied | 282 | 1,606 | 3,384 | |
--Renter-Occupied | 147 | 719 | 1,426 | |
Owner-Occupied Values | < 100K | 26 | 378 | 859 |
100-199K | 163 | 771 | 1557 | |
200-299K | 71 | 290 | 543 | |
300-399K | 14 | 100 | 220 | |
400-499K | 6 | 42 | 99 | |
500K+ | 3 | 25 | 106 | |
Total Working Age Population | 1,059 | 6,080 | 11,975 | |
In Work Force | 662 | 4,106 | 7,944 | |
Not In Work Force | 398 | 1,974 | 4,031 | |
Workforce Employed | 552 | 3,723 | 7,371 | |
Workforce Unemployed | 109 | 383 | 573 | |
Civlian Workforce | 662 | 4,106 | 7,944 | |
Military Workforce | 0 | 0 | 0 | |
Total Households | 428 | 2,324 | 4,810 | |
Family Households | 304 | 1,708 | 3,434 | |
Non-Family Households | 125 | 617 | 1,376 | |
Married Couple | 217 | 1,238 | 2,482 | |
Other Family | 87 | 470 | 952 | |
Married w/Child | 117 | 640 | 1,292 | |
Single Male w/Child | 3 | 49 | 109 | |
Single Female w/Child | 57 | 219 | 374 |
Population Change Last Two Decades - Plus Projection
2000 | % | 2010 | % | 2020 | % | 2030 | |
---|---|---|---|---|---|---|---|
Texas | 20,851,820 | +21 | 25,145,561 | +18 | 29,677,668 | +18 | 34,894,452 |
Bastrop County | 57,733 | +28 | 74,171 | +16 | 86,105 | +15 | 99,211 |
Travis County | 812,280 | +26 | 1,024,266 | +26 | 1,291,502 | +19 | 1,540,812 |
Williamson County | 249,967 | +69 | 422,679 | +40 | 589,914 | +41 | 830,421 |
Total Working Age Population:
Total Households:
Total Working Age Population:
Total Households:
Total Working Age Population:
Total Households: