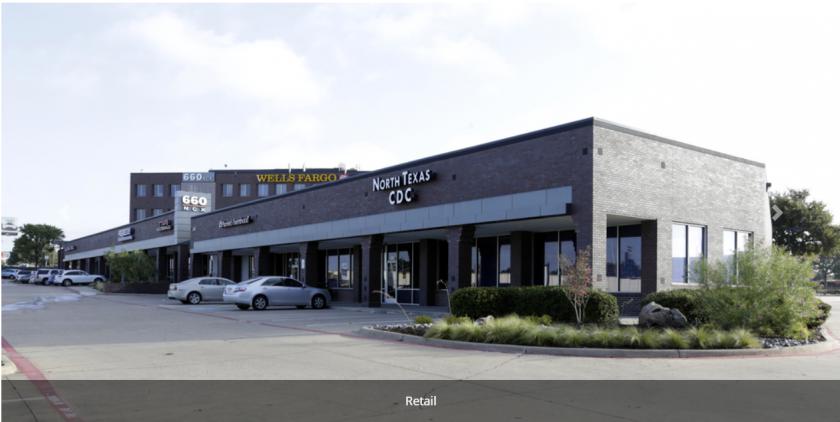
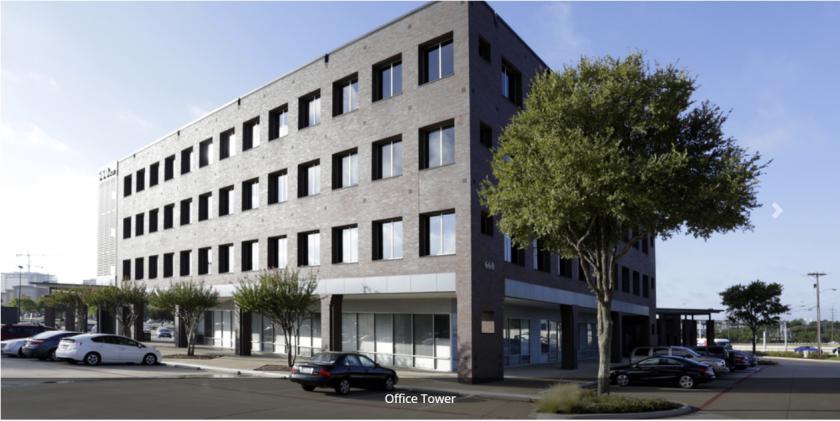
1-Mile | 3-Miles | 5-Miles | ||
---|---|---|---|---|
Total Population | 7,439 | 98,577 | 292,942 | |
Population Median Age | 35 | 38 | 39 | |
Population by Age | 0-9 Yrs | 818 (10%) | 11254 (11%) | 33759 (11%) |
10-19 Yrs | 808 (10%) | 12446 (12%) | 36656 (12%) | |
20-29 Yrs | 1642 (22%) | 15515 (15%) | 43445 (14%) | |
30-39 Yrs | 1401 (18%) | 14401 (14%) | 42069 (14%) | |
40-49 Yrs | 808 (10%) | 12635 (12%) | 37053 (12%) | |
50-59 Yrs | 940 (12%) | 12390 (12%) | 38992 (13%) | |
60-69 Yrs | 523 (7%) | 10638 (10%) | 33375 (11%) | |
70+ Yrs | 499 (6%) | 9297 (9%) | 27594 (9%) | |
Median HH Income | $64,991 | $74,780 | $79,519 | |
Total Household Income | < 24K | 549 (18%) | 5083 (13%) | 14271 (13%) |
25-49K | 570 (19%) | 6386 (17%) | 18808 (17%) | |
50-74K | 610 (20%) | 6755 (18%) | 18619 (17%) | |
75-99K | 435 (14%) | 5021 (13%) | 14354 (13%) | |
100-199K | 633 (21%) | 9951 (27%) | 31826 (29%) | |
200K+ | 131 (4%) | 3130 (8%) | 10709 (9%) | |
Highest Education Level | No Diploma | 903 | 7745 | 17238 |
Diploma or GED | 763 | 10256 | 28890 | |
Some College | 1020 | 13881 | 40372 | |
Assoc. Degree | 292 | 4137 | 14015 | |
Bachelors Degree | 1293 | 19687 | 64762 | |
Higher Degree | 765 | 10755 | 35846 | |
Total Housing Units | 3,258 | 38,621 | 115,132 | |
--Owner-Occupied | 825 | 21,332 | 66,350 | |
--Renter-Occupied | 2,103 | 14,994 | 42,237 | |
Owner-Occupied Values | < 100K | 66 | 1042 | 3103 |
100-199K | 437 | 6584 | 19544 | |
200-299K | 171 | 7448 | 22620 | |
300-399K | 91 | 3742 | 12871 | |
400-499K | 42 | 1600 | 5323 | |
500K+ | 17 | 917 | 2889 | |
Total Working Age Population | 6,178 | 80,281 | 237,581 | |
In Work Force | 4,382 | 55,239 | 163,187 | |
Not In Work Force | 1,797 | 25,042 | 74,395 | |
Workforce Employed | 4,204 | 53,108 | 156,068 | |
Workforce Unemployed | 178 | 2,104 | 6,983 | |
Civlian Workforce | 4,382 | 55,212 | 163,051 | |
Military Workforce | 0 | 26 | 135 | |
Total Households | 2,927 | 36,327 | 108,587 | |
Family Households | 1,590 | 24,174 | 73,927 | |
Non-Family Households | 1,338 | 12,152 | 34,660 | |
Married Couple | 1,012 | 18,007 | 57,462 | |
Other Family | 578 | 6,167 | 16,465 | |
Married w/Child | 460 | 7,087 | 24,181 | |
Single Male w/Child | 103 | 714 | 1,881 | |
Single Female w/Child | 156 | 2,617 | 6,124 |
Population Change Last Two Decades - Plus Projection
2000 | % | 2010 | % | 2020 | % | 2030 | |
---|---|---|---|---|---|---|---|
Texas | 20,851,820 | +21 | 25,145,561 | +18 | 29,677,668 | +18 | 34,894,452 |
Dallas County | 2,218,899 | +7 | 2,368,139 | +15 | 2,734,111 | +14 | 3,106,298 |
Collin County | 491,675 | +59 | 782,341 | +33 | 1,039,369 | +34 | 1,391,461 |
Total Working Age Population:
Total Households:
Total Working Age Population:
Total Households:
Total Working Age Population:
Total Households: