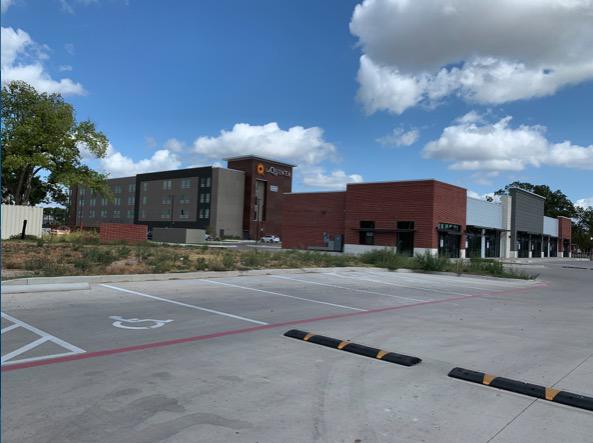
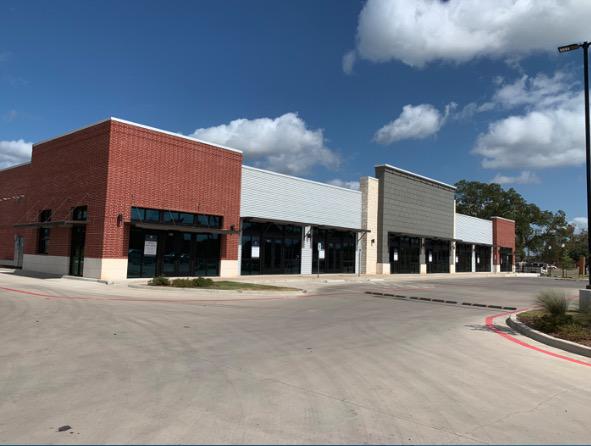
This retail development is located on I-35, near Baylor University in Waco, Texas.
Situated along I-35, which consists of 505 miles in Texas and 1,569 miles from Mexico to Canada
Close proximity to Baylor University [16,186 students] and McLane Stadium [capacity of 45,140]
Located within walking distance to Magnolia Market, which attracts 33,665 visitors per week
Waco has the highest hotel capacity in the state of Texas at 80–90%. There are 3 hotels [aloft, LaQuinta, and Staybridge Suites] adjacent to West Bay Shopping Center within walking distance
The VA Regional Office is blocks away with 400 employees who only get 30 minutes for lunch
There are 310 new multi-family | student housing units within walking distance to the site
NNN: Estimated $10.00 PSF
LEASE RATES: Please call for rates
No part of this information may be copied, reproduced, repurposed, or screen-captured for any commercial purpose without prior written authorization from MyEListing.
While we strive to provide the most accurate information, all listing information, and demographic data, is provided by third-parties. As such, MyEListing will not be responsible for the accuracy of the information. It is strongly recommended that you verify all information with the listing agent, and any relevant agencies, prior to making any decisions.
What is the building size of this commercial Retail property?
The size of this multi-unit property varies between 1200 - 12500 square feet
What kind of Retail is the propery at 1011 S 10th St?
The property at 1011 S 10th St Waco, TX 76706 is listed as a Shopping Center Retail property
What is the population within 1 mile of 1011 S 10th St in Waco?
The population within 1 mile of 1011 S 10th St Waco, TX 76706 is 14,727 people.
Who do I contact for questions about 1011 S 10th St?
You should contact the listing agent,
Shelley Taylor, for any details regarding this commercial listing.