Office Space
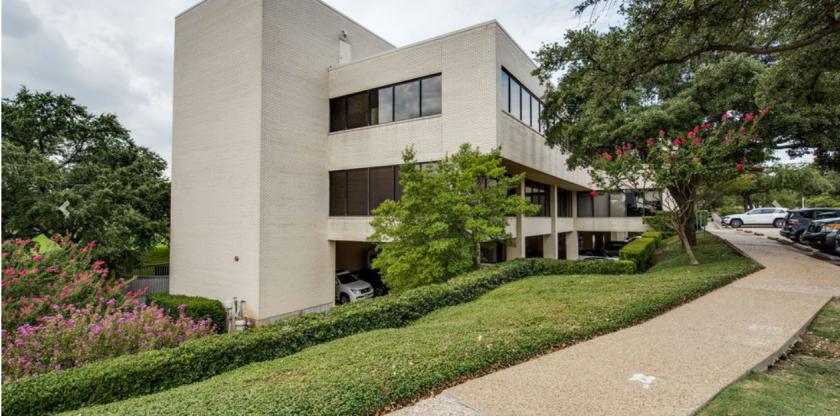
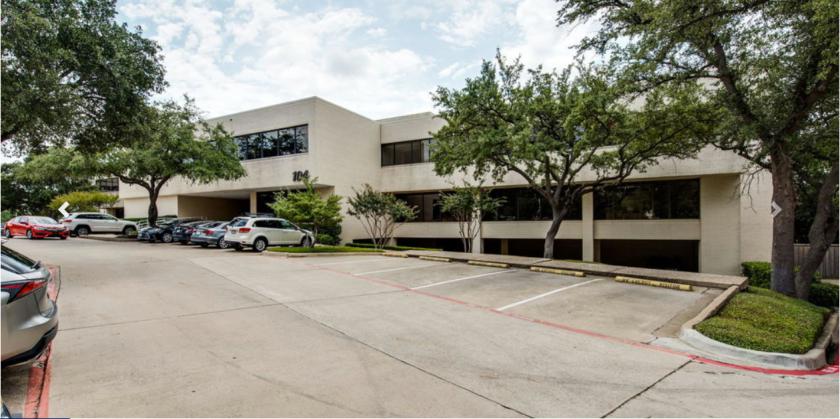
106 Decker Court Irving, TX 75062
106 Decker Court Irving, TX 75062
Details & Description
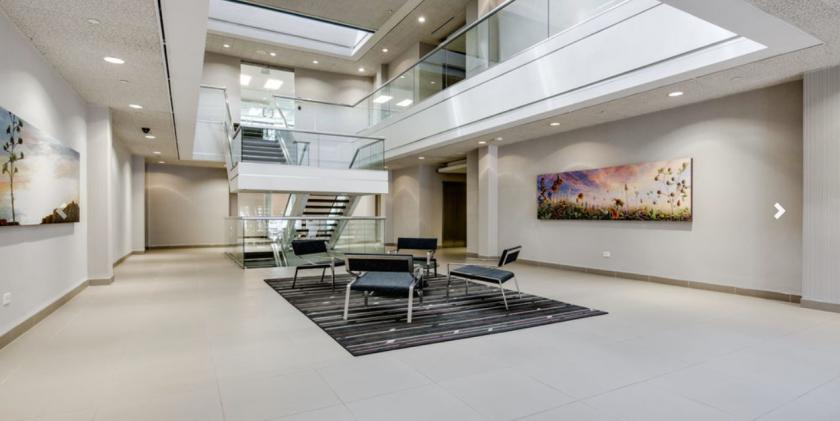
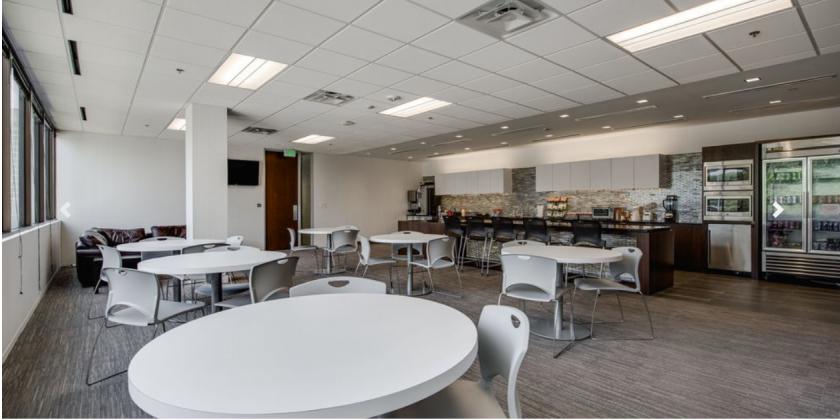
Additional Photos
Listing Agents

Bruce Butler
O: 214-269-3122
M: 214-549-1471
bruce.butler@avisonyoung.com
O: 214-269-3122
M: 214-549-1471
bruce.butler@avisonyoung.com

John Bowles
O: 214-269-3102
M: 972-898-9944
john.bowles@avisonyoung.com
O: 214-269-3102
M: 972-898-9944
john.bowles@avisonyoung.com

Susan Gwin Burks
O: 214-269-3106
M: 214-244-6054
susangwin.burks@avisonyoung.com
O: 214-269-3106
M: 214-244-6054
susangwin.burks@avisonyoung.com
While we strive to provide the most accurate information, all listing information, and demographic data, is provided by third-parties. As such, MyEListing will not be responsible for the accuracy of the information. It is strongly recommended that you verify all information with the listing agent, and any relevant agencies, prior to making any decisions.


