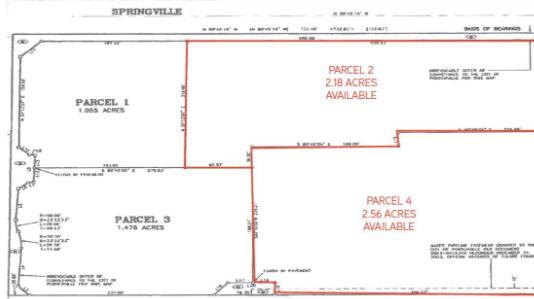
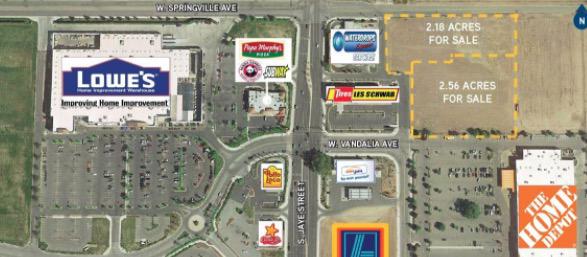
1-Mile | 3-Miles | 5-Miles | ||
---|---|---|---|---|
Total Population | 11,607 | 55,709 | 70,182 | |
Population Median Age | 32 | 33 | 33 | |
Population by Age | 0-9 Yrs | 1980 (17%) | 9632 (17%) | 11818 (16%) |
10-19 Yrs | 2196 (18%) | 9788 (17%) | 12684 (18%) | |
20-29 Yrs | 1863 (16%) | 8438 (15%) | 10412 (14%) | |
30-39 Yrs | 1368 (11%) | 7435 (13%) | 9079 (12%) | |
40-49 Yrs | 1689 (14%) | 6408 (11%) | 8254 (11%) | |
50-59 Yrs | 948 (8%) | 5798 (10%) | 7243 (10%) | |
60-69 Yrs | 873 (7%) | 4222 (7%) | 5444 (7%) | |
70+ Yrs | 689 (5%) | 3988 (7%) | 5247 (7%) | |
Median HH Income | $29,527 | $38,263 | $41,182 | |
Total Household Income | < 24K | 1406 (43%) | 5600 (35%) | 6457 (32%) |
25-49K | 943 (29%) | 4333 (27%) | 5248 (26%) | |
50-74K | 389 (12%) | 2466 (15%) | 3123 (15%) | |
75-99K | 159 (4%) | 1256 (7%) | 1721 (8%) | |
100-199K | 287 (8%) | 1807 (11%) | 2623 (13%) | |
200K+ | 13 (0%) | 273 (1%) | 512 (2%) | |
Highest Education Level | No Diploma | 2709 | 11555 | 13578 |
Diploma or GED | 1806 | 9122 | 11619 | |
Some College | 1182 | 6078 | 7978 | |
Assoc. Degree | 312 | 2097 | 2848 | |
Bachelors Degree | 245 | 2023 | 2726 | |
Higher Degree | 69 | 971 | 1464 | |
Total Housing Units | 3,379 | 17,105 | 21,321 | |
--Owner-Occupied | 1,283 | 7,709 | 10,437 | |
--Renter-Occupied | 1,914 | 8,026 | 9,247 | |
Owner-Occupied Values | < 100K | 343 | 1408 | 1708 |
100-199K | 706 | 4380 | 5351 | |
200-299K | 91 | 1355 | 2330 | |
300-399K | 83 | 284 | 535 | |
400-499K | 37 | 134 | 223 | |
500K+ | 23 | 148 | 289 | |
Total Working Age Population | 8,465 | 40,168 | 50,580 | |
In Work Force | 4,936 | 23,113 | 29,132 | |
Not In Work Force | 3,529 | 17,056 | 21,449 | |
Workforce Employed | 4,206 | 20,159 | 25,618 | |
Workforce Unemployed | 730 | 2,943 | 3,480 | |
Civlian Workforce | 4,936 | 23,102 | 29,098 | |
Military Workforce | 0 | 11 | 33 | |
Total Households | 3,197 | 15,735 | 19,684 | |
Family Households | 2,523 | 11,693 | 14,866 | |
Non-Family Households | 673 | 4,042 | 4,818 | |
Married Couple | 1,594 | 7,267 | 9,495 | |
Other Family | 929 | 4,426 | 5,372 | |
Married w/Child | 986 | 4,021 | 5,158 | |
Single Male w/Child | 87 | 608 | 854 | |
Single Female w/Child | 368 | 1,685 | 2,084 |
Population Change Last Two Decades - Plus Projection
2000 | % | 2010 | % | 2020 | % | 2030 | |
---|---|---|---|---|---|---|---|
California | 33,871,648 | +10 | 37,253,956 | +9 | 40,467,295 | +8 | 43,631,295 |
Tulare County | 368,021 | +20 | 442,179 | +10 | 486,677 | +11 | 538,641 |
Total Working Age Population:
Total Households:
Total Working Age Population:
Total Households:
Total Working Age Population:
Total Households: