Industrial Properties
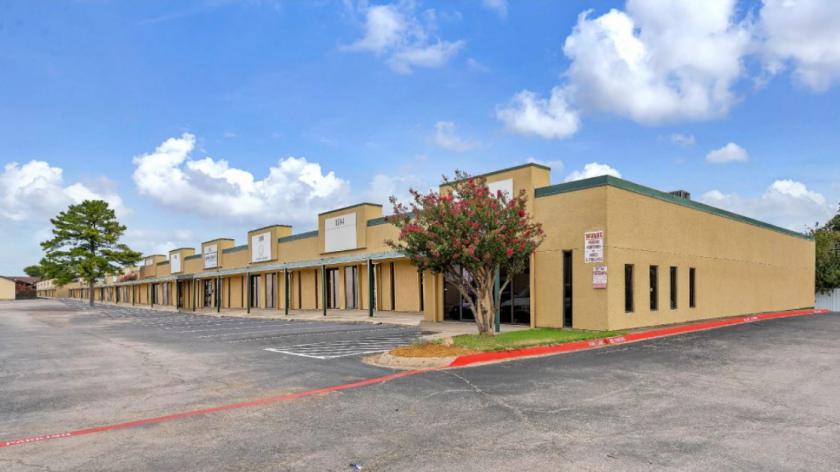
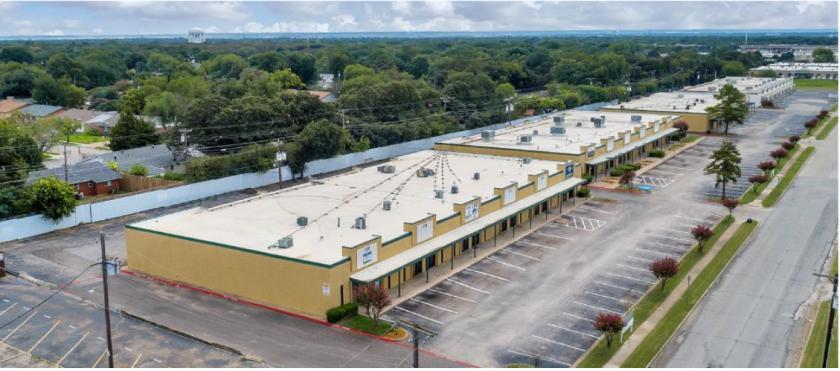
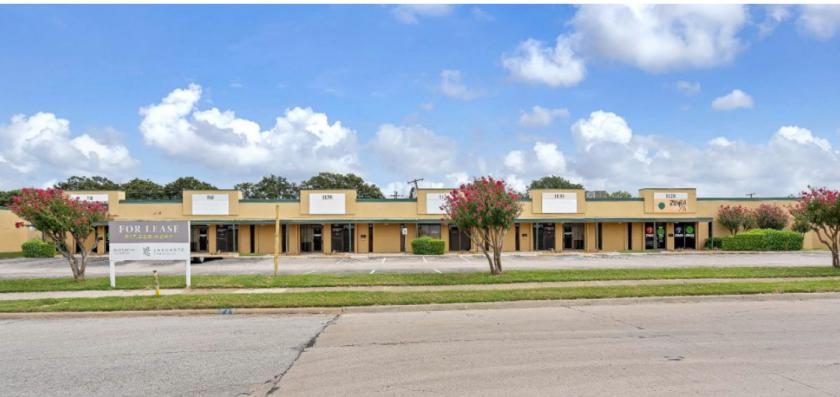
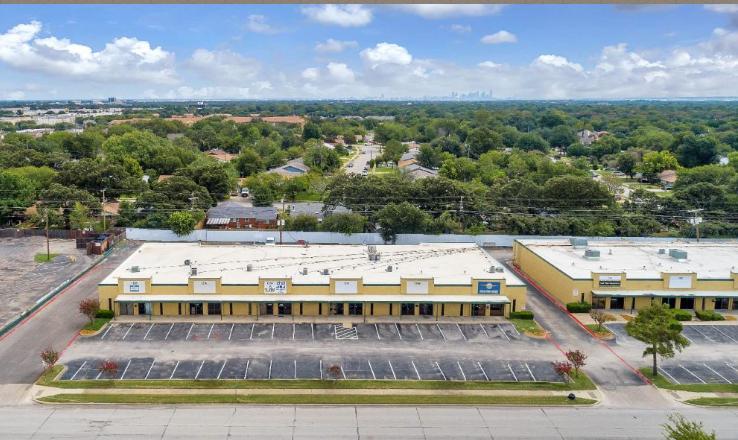
1220 Luke St Irving, TX 75061
1220 Luke St Irving, TX 75061
Details & Description
Additional Photos

Listing Agents

Sarah LanCarte
O: 817-409-4040
M: 817-228-4247
sarah@lancartecre.com
O: 817-409-4040
M: 817-228-4247
sarah@lancartecre.com

David Corley III
LanCarte Commercial
O: 817-909-0650
dcorley@lancartecre.com
LanCarte Commercial
O: 817-909-0650
dcorley@lancartecre.com
While we strive to provide the most accurate information, all listing information, and demographic data, is provided by third-parties. As such, MyEListing will not be responsible for the accuracy of the information. It is strongly recommended that you verify all information with the listing agent, and any relevant agencies, prior to making any decisions.


