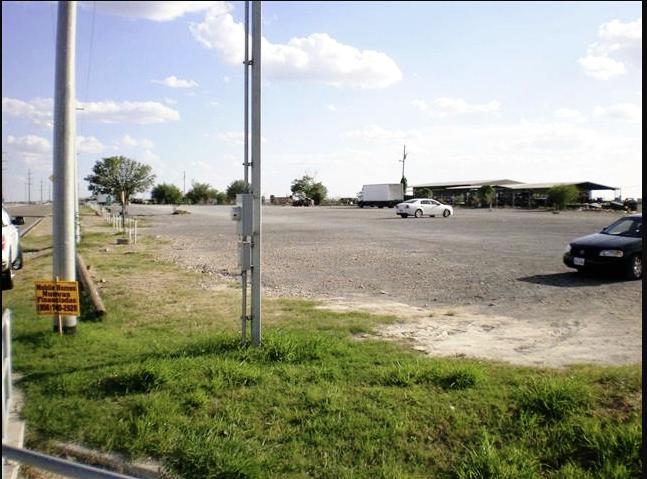
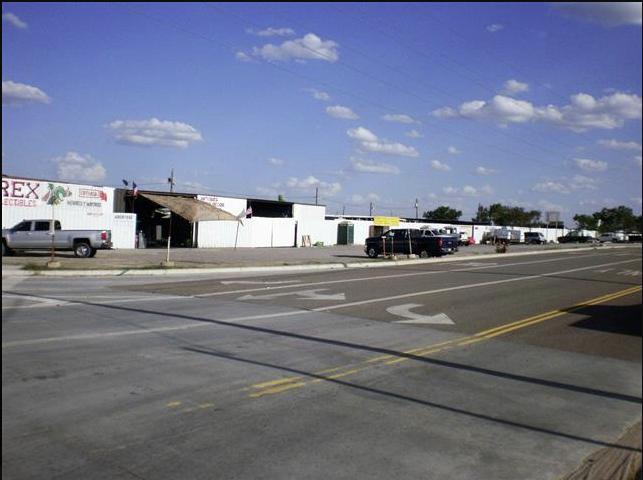
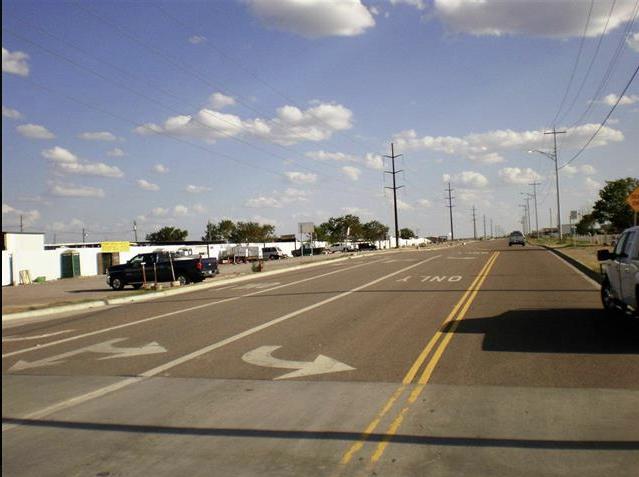
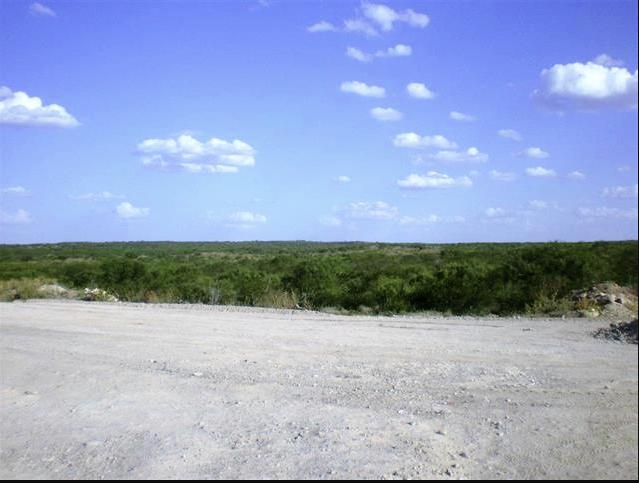
1-Mile | 3-Miles | 5-Miles | ||
---|---|---|---|---|
Total Population | 5,732 | 56,731 | 139,155 | |
Population Median Age | 28 | 30 | 31 | |
Population by Age | 0-9 Yrs | 1323 (23%) | 11203 (19%) | 27490 (19%) |
10-19 Yrs | 933 (16%) | 10543 (18%) | 25551 (18%) | |
20-29 Yrs | 936 (16%) | 9335 (16%) | 21914 (15%) | |
30-39 Yrs | 1047 (18%) | 7970 (14%) | 18214 (13%) | |
40-49 Yrs | 691 (12%) | 6699 (11%) | 16180 (11%) | |
50-59 Yrs | 508 (8%) | 4742 (8%) | 12091 (8%) | |
60-69 Yrs | 149 (2%) | 3396 (5%) | 8973 (6%) | |
70+ Yrs | 146 (2%) | 2844 (5%) | 8743 (6%) | |
Median HH Income | $56,614 | $40,833 | $34,316 | |
Total Household Income | < 24K | 346 (23%) | 4593 (31%) | 13609 (37%) |
25-49K | 277 (18%) | 4081 (28%) | 10366 (28%) | |
50-74K | 329 (22%) | 2574 (17%) | 5446 (14%) | |
75-99K | 315 (21%) | 1534 (10%) | 3081 (8%) | |
100-199K | 166 (11%) | 1660 (11%) | 3483 (9%) | |
200K+ | 33 (2%) | 132 (0%) | 432 (1%) | |
Highest Education Level | No Diploma | 966 | 11287 | 29508 |
Diploma or GED | 944 | 9319 | 21666 | |
Some College | 461 | 4765 | 11296 | |
Assoc. Degree | 306 | 1817 | 4334 | |
Bachelors Degree | 245 | 2220 | 5757 | |
Higher Degree | 87 | 692 | 1871 | |
Total Housing Units | 1,572 | 15,797 | 40,236 | |
--Owner-Occupied | 1,129 | 9,298 | 20,968 | |
--Renter-Occupied | 338 | 5,277 | 15,450 | |
Owner-Occupied Values | < 100K | 467 | 4349 | 10810 |
100-199K | 625 | 4459 | 8382 | |
200-299K | 34 | 340 | 1093 | |
300-399K | 2 | 93 | 380 | |
400-499K | 0 | 25 | 81 | |
500K+ | 1 | 32 | 223 | |
Total Working Age Population | 3,857 | 38,732 | 95,516 | |
In Work Force | 2,644 | 23,226 | 53,591 | |
Not In Work Force | 1,214 | 15,506 | 41,925 | |
Workforce Employed | 2,489 | 21,863 | 50,360 | |
Workforce Unemployed | 154 | 1,298 | 3,156 | |
Civlian Workforce | 2,644 | 23,161 | 53,516 | |
Military Workforce | 0 | 65 | 75 | |
Total Households | 1,466 | 14,574 | 36,418 | |
Family Households | 1,222 | 12,234 | 29,191 | |
Non-Family Households | 245 | 2,341 | 7,226 | |
Married Couple | 825 | 7,673 | 17,798 | |
Other Family | 397 | 4,561 | 11,393 | |
Married w/Child | 481 | 4,201 | 9,561 | |
Single Male w/Child | 125 | 566 | 1,260 | |
Single Female w/Child | 149 | 2,153 | 4,924 |
Population Change Last Two Decades - Plus Projection
2000 | % | 2010 | % | 2020 | % | 2030 | |
---|---|---|---|---|---|---|---|
Texas | 20,851,820 | +21 | 25,145,561 | +18 | 29,677,668 | +18 | 34,894,452 |
Webb County | 193,117 | +30 | 250,304 | +10 | 276,183 | +8 | 298,373 |
Total Working Age Population:
Total Households:
Total Working Age Population:
Total Households:
Total Working Age Population:
Total Households: