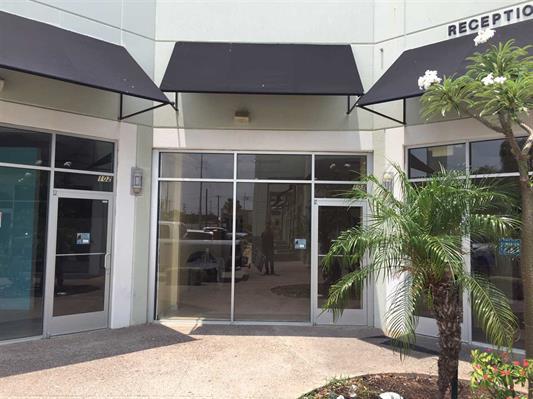
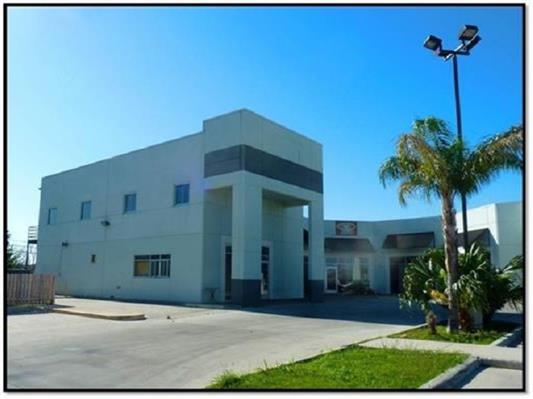
1-Mile | 3-Miles | 5-Miles | ||
---|---|---|---|---|
Total Population | 12,838 | 69,057 | 141,525 | |
Population Median Age | 36 | 34 | 33 | |
Population by Age | 0-9 Yrs | 1556 (12%) | 10623 (15%) | 24058 (16%) |
10-19 Yrs | 2295 (17%) | 12682 (18%) | 25076 (17%) | |
20-29 Yrs | 1641 (12%) | 9068 (13%) | 20005 (14%) | |
30-39 Yrs | 1523 (11%) | 8855 (12%) | 18367 (12%) | |
40-49 Yrs | 1844 (14%) | 10213 (14%) | 18991 (13%) | |
50-59 Yrs | 1795 (13%) | 7663 (11%) | 14695 (10%) | |
60-69 Yrs | 1266 (9%) | 5632 (8%) | 10686 (7%) | |
70+ Yrs | 918 (7%) | 4321 (6%) | 9648 (6%) | |
Median HH Income | $84,216 | $70,462 | $50,669 | |
Total Household Income | < 24K | 629 (15%) | 3606 (17%) | 11219 (27%) |
25-49K | 638 (15%) | 3962 (19%) | 9144 (22%) | |
50-74K | 502 (12%) | 3351 (16%) | 6509 (15%) | |
75-99K | 709 (17%) | 2901 (13%) | 4562 (11%) | |
100-199K | 1262 (31%) | 5415 (26%) | 7813 (18%) | |
200K+ | 320 (7%) | 1489 (7%) | 1891 (4%) | |
Highest Education Level | No Diploma | 837 | 5871 | 19819 |
Diploma or GED | 1527 | 8859 | 19286 | |
Some College | 1692 | 7836 | 14107 | |
Assoc. Degree | 825 | 3609 | 6398 | |
Bachelors Degree | 2196 | 9869 | 14961 | |
Higher Degree | 1023 | 4858 | 6743 | |
Total Housing Units | 4,236 | 22,011 | 44,658 | |
--Owner-Occupied | 3,121 | 14,346 | 24,907 | |
--Renter-Occupied | 939 | 6,378 | 16,231 | |
Owner-Occupied Values | < 100K | 169 | 1426 | 6008 |
100-199K | 1640 | 7165 | 11369 | |
200-299K | 809 | 3337 | 4662 | |
300-399K | 285 | 1367 | 1692 | |
400-499K | 128 | 474 | 550 | |
500K+ | 91 | 578 | 626 | |
Total Working Age Population | 10,016 | 50,742 | 102,350 | |
In Work Force | 6,967 | 34,381 | 63,538 | |
Not In Work Force | 3,049 | 16,361 | 38,812 | |
Workforce Employed | 6,693 | 33,296 | 60,789 | |
Workforce Unemployed | 274 | 1,085 | 2,738 | |
Civlian Workforce | 6,967 | 34,381 | 63,527 | |
Military Workforce | 0 | 0 | 11 | |
Total Households | 4,060 | 20,724 | 41,138 | |
Family Households | 3,050 | 16,361 | 31,944 | |
Non-Family Households | 1,009 | 4,363 | 9,194 | |
Married Couple | 2,128 | 11,629 | 21,184 | |
Other Family | 923 | 4,732 | 10,759 | |
Married w/Child | 1,036 | 6,351 | 11,590 | |
Single Male w/Child | 101 | 421 | 957 | |
Single Female w/Child | 370 | 2,279 | 4,723 |
Population Change Last Two Decades - Plus Projection
2000 | % | 2010 | % | 2020 | % | 2030 | |
---|---|---|---|---|---|---|---|
Texas | 20,851,820 | +21 | 25,145,561 | +18 | 29,677,668 | +18 | 34,894,452 |
Webb County | 193,117 | +30 | 250,304 | +10 | 276,183 | +8 | 298,373 |
Total Working Age Population:
Total Households:
Total Working Age Population:
Total Households:
Total Working Age Population:
Total Households: