Retail Space
601 W 15TH STREET Plano, TX 75075
601 W 15TH STREET Plano, TX 75075
Details & Description
Property Highlights
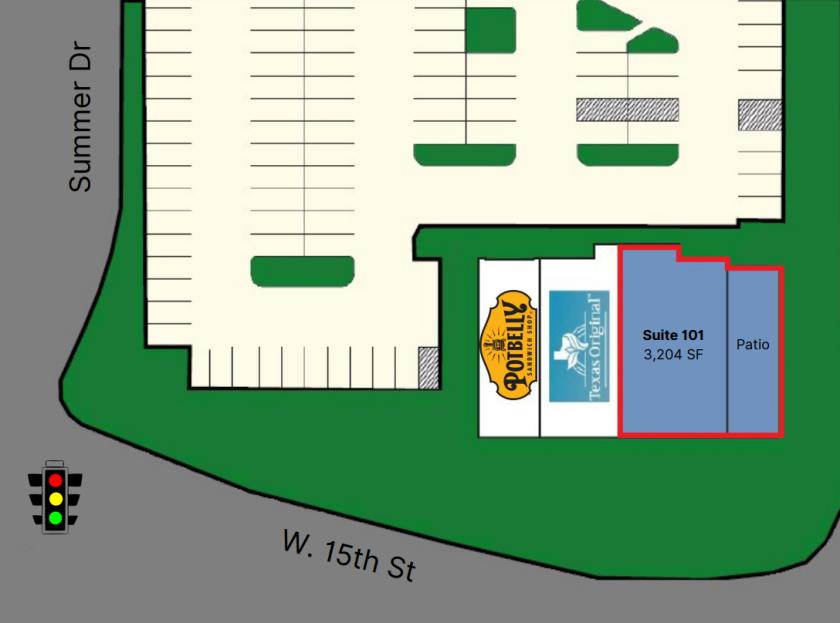
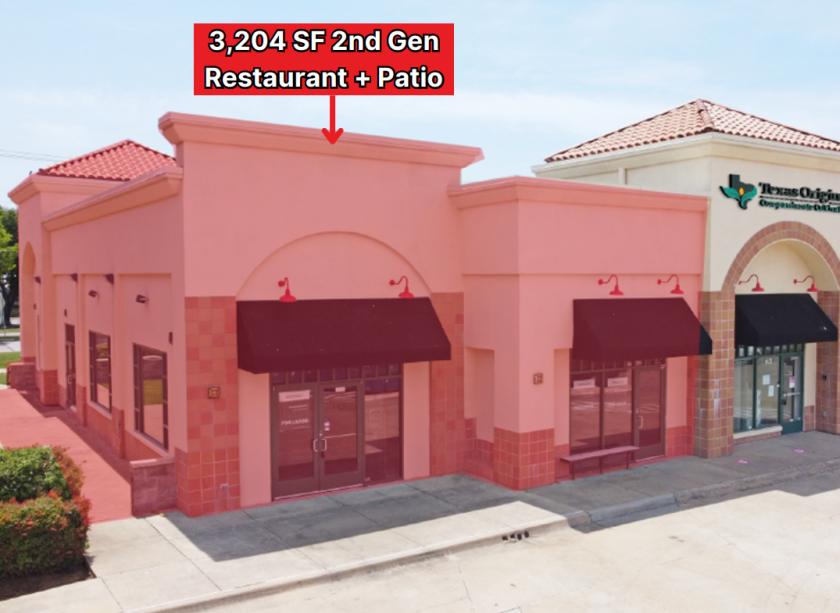
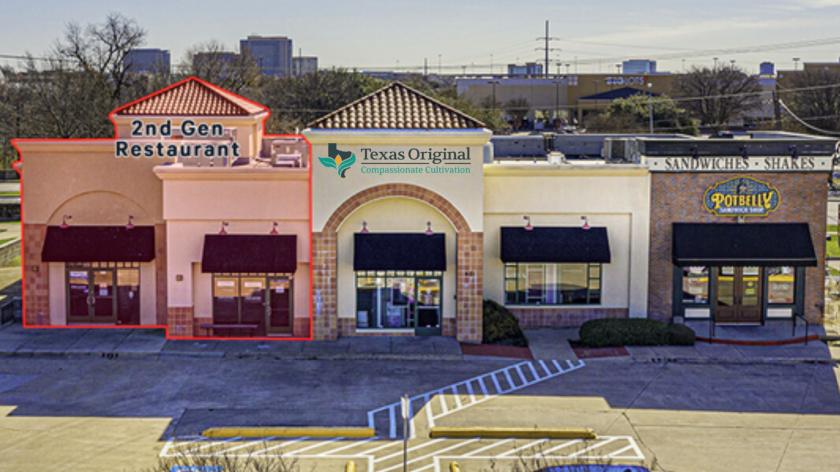
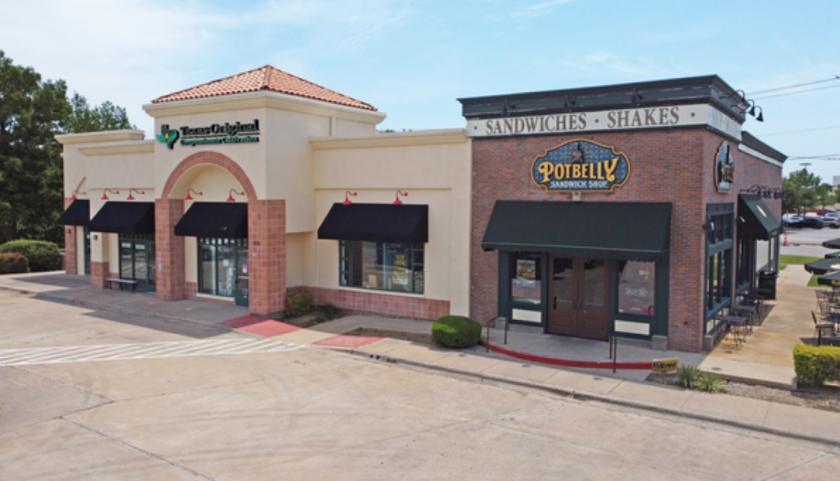
- • 3,204 SF 2nd Gen Restaurant + Patio
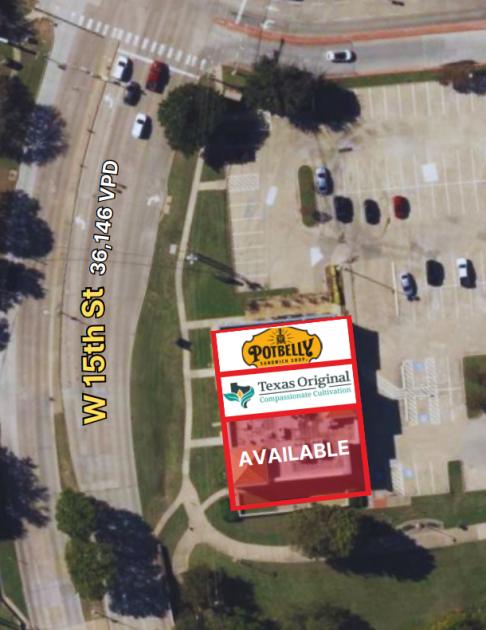
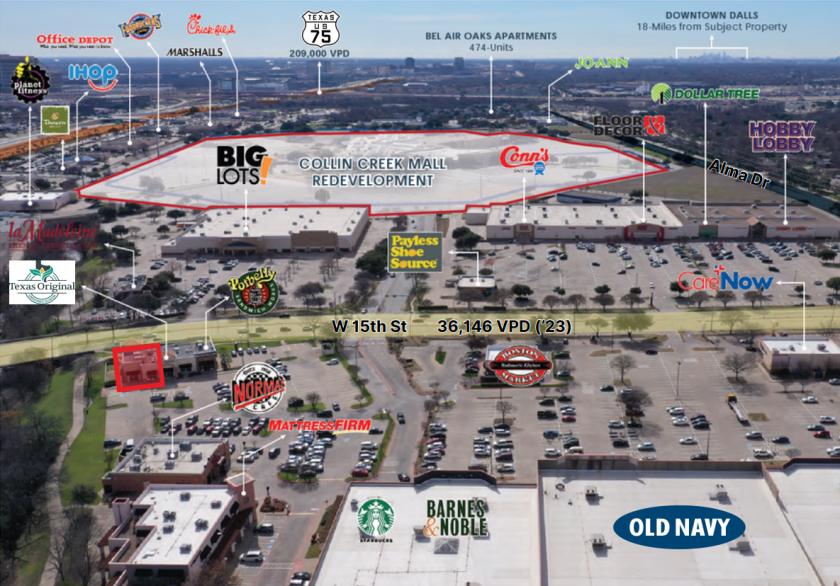
- • Quick and convenient access to US-75
- • Adjacent to 9.3-mile Chisholm Trail
Additional Photos
Listing Agents

Eric Deuillet
O: 214-373-8300
M: 214-466-1545
eric@structurecommercial.com
O: 214-373-8300
M: 214-466-1545
eric@structurecommercial.com

Jeremy Cummings
O: 214-466-1544
M: 214-636-2549
jeremy@structurecommercial.com
O: 214-466-1544
M: 214-636-2549
jeremy@structurecommercial.com
While we strive to provide the most accurate information, all listing information, and demographic data, is provided by third-parties. As such, MyEListing will not be responsible for the accuracy of the information. It is strongly recommended that you verify all information with the listing agent, and any relevant agencies, prior to making any decisions.