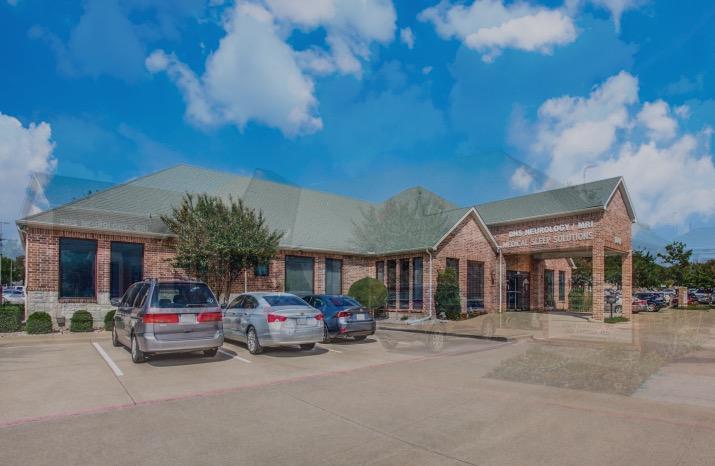
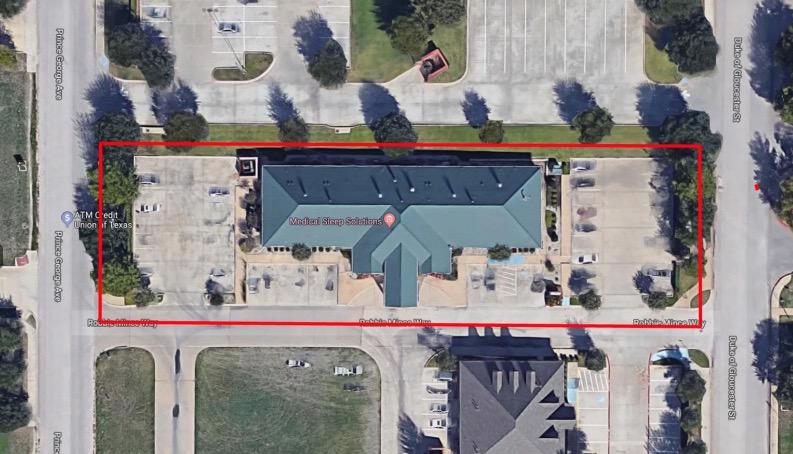
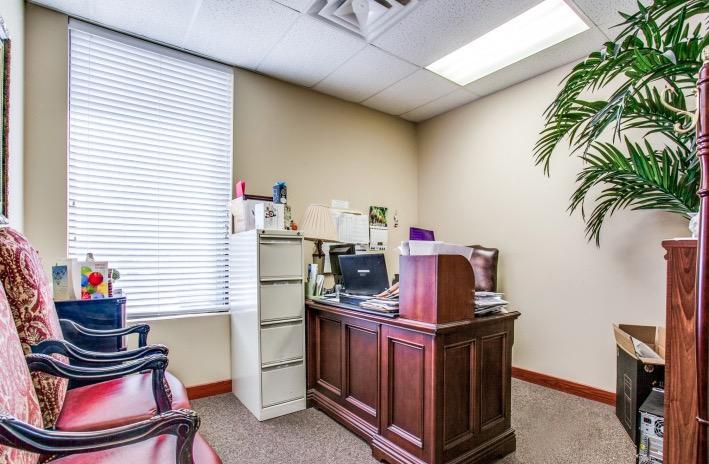
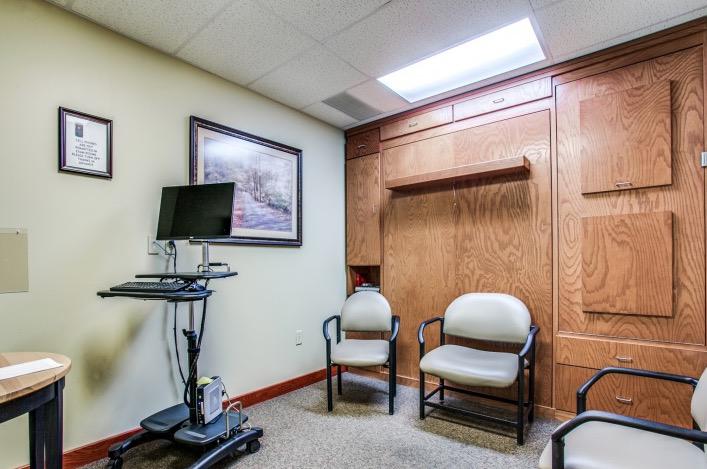
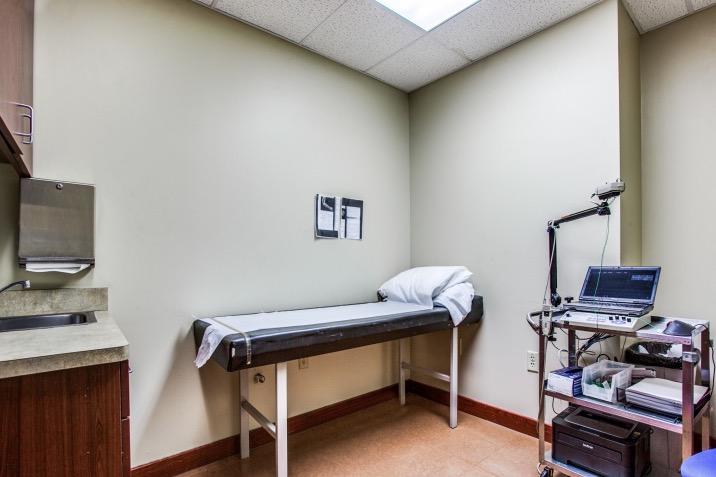
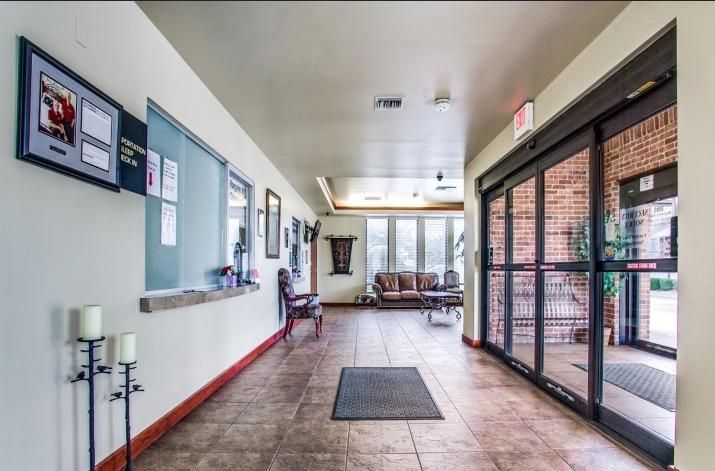
Mote & Associates is pleased to offer the opportunity to acquire a +/-8,061 SF multi-tenant medical office building in DeSoto, TX in the Williamsburg Village Medical District adjacent to Methodist Charlton Hospital.Property is currently occupied by Medical Sleep Solutions, LLC. and Dallas Neuroscience, P,A. Both groups are entities of the seller and are interested in signing a 5 year lease renewal at $23.00 SF modified gross. If buyer requires occupancy of the whole building, the groups would consider relocating. A third suite of +/-1,680 SF is available for currently on the market for lease, which could also be made available for an owner-occupant.Tenants are on modified gross leases with the tenants paying their own utilities. Landlord is responsible for repairs and maintenance, property taxes, insurance, roof and structure, and common area maintenance.DeSoto is a growing city of 56,224 people just +/-15.8 miles from the heart of Dallas and centrally located between I-20, I-35, and US Highway 67. Property is only +/-0.4 miles from US-67, +/-1.4 miles from I-20, +/-3.8 miles from I-35E. Average household income for DeSoto is estimated at $91,237, per the city of DeSoto.The subject property is located just a block away from Methodist Charlton Hospital, +/-4.0 miles to Dallas Executive airport, +/-19.0 miles to Dallas Love Field Airport, and +/-26.6 miles to DFW International Airport. The subject property enjoys the benefits of attracting a vast source of local workforce and patients with the DART line located on Wheatland Drive, just +/-0.1 miles from the subject property. PROPERTY TYPE :Medical OfficeLISTING TYPE :For SaleLISTING ID :1166PRICE :$1,640,000VIEW :StreetYEAR BUILT :2004LOT AREA :8,061 Sqft