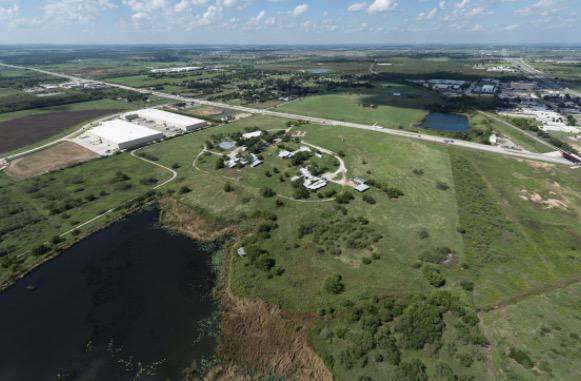
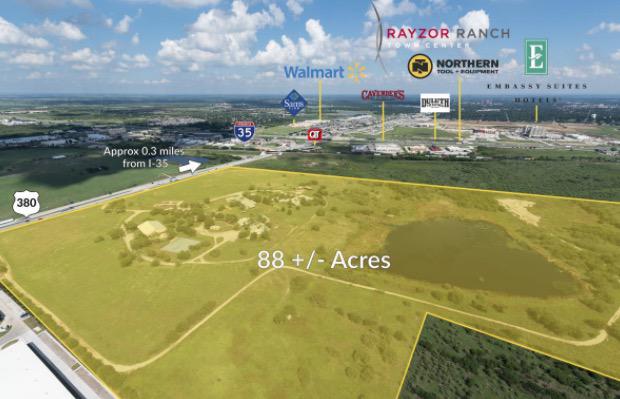
1-Mile | 3-Miles | 5-Miles | ||
---|---|---|---|---|
Total Population | 1,472 | 32,573 | 88,243 | |
Population Median Age | 37 | 31 | 33 | |
Population by Age | 0-9 Yrs | 140 (9%) | 1895 (5%) | 8486 (9%) |
10-19 Yrs | 148 (10%) | 7183 (22%) | 13576 (15%) | |
20-29 Yrs | 347 (23%) | 11576 (35%) | 26715 (30%) | |
30-39 Yrs | 221 (15%) | 3550 (10%) | 10819 (12%) | |
40-49 Yrs | 213 (14%) | 2560 (7%) | 8708 (9%) | |
50-59 Yrs | 149 (10%) | 2173 (6%) | 8134 (9%) | |
60-69 Yrs | 140 (9%) | 1663 (5%) | 6401 (7%) | |
70+ Yrs | 114 (7%) | 1974 (6%) | 5403 (6%) | |
Median HH Income | $75,788 | $37,150 | $46,712 | |
Total Household Income | < 24K | 57 (10%) | 3939 (35%) | 8531 (27%) |
25-49K | 113 (21%) | 2842 (25%) | 7910 (25%) | |
50-74K | 94 (17%) | 1568 (14%) | 5623 (17%) | |
75-99K | 106 (19%) | 1131 (10%) | 3555 (11%) | |
100-199K | 156 (29%) | 1503 (13%) | 4619 (14%) | |
200K+ | 8 (1%) | 150 (1%) | 1005 (3%) | |
Highest Education Level | No Diploma | 80 | 1595 | 5506 |
Diploma or GED | 199 | 2837 | 9870 | |
Some College | 257 | 3940 | 11723 | |
Assoc. Degree | 97 | 1248 | 3745 | |
Bachelors Degree | 262 | 4020 | 12064 | |
Higher Degree | 126 | 2088 | 6336 | |
Total Housing Units | 570 | 12,461 | 34,516 | |
--Owner-Occupied | 355 | 3,577 | 12,465 | |
--Renter-Occupied | 179 | 7,556 | 18,777 | |
Owner-Occupied Values | < 100K | 46 | 454 | 1921 |
100-199K | 211 | 2106 | 6147 | |
200-299K | 78 | 784 | 2894 | |
300-399K | 11 | 117 | 817 | |
400-499K | 2 | 45 | 235 | |
500K+ | 8 | 71 | 450 | |
Total Working Age Population | 1,242 | 29,587 | 75,346 | |
In Work Force | 920 | 19,036 | 51,005 | |
Not In Work Force | 322 | 10,552 | 24,341 | |
Workforce Employed | 885 | 17,412 | 47,636 | |
Workforce Unemployed | 31 | 1,582 | 3,312 | |
Civlian Workforce | 916 | 18,993 | 50,948 | |
Military Workforce | 4 | 42 | 57 | |
Total Households | 535 | 11,133 | 31,242 | |
Family Households | 346 | 4,400 | 15,803 | |
Non-Family Households | 189 | 6,733 | 15,439 | |
Married Couple | 274 | 3,244 | 11,166 | |
Other Family | 71 | 1,156 | 4,637 | |
Married w/Child | 90 | 1,153 | 4,468 | |
Single Male w/Child | 13 | 126 | 478 | |
Single Female w/Child | 22 | 419 | 1,786 |
Population Change Last Two Decades - Plus Projection
2000 | % | 2010 | % | 2020 | % | 2030 | |
---|---|---|---|---|---|---|---|
Texas | 20,851,820 | +21 | 25,145,561 | +18 | 29,677,668 | +18 | 34,894,452 |
Denton County | 432,976 | +53 | 662,614 | +36 | 897,953 | +37 | 1,234,110 |
Total Working Age Population:
Total Households:
Total Working Age Population:
Total Households:
Total Working Age Population:
Total Households: