Industrial Properties
E Euless Blvd S Euless, TX 76040
E Euless Blvd S Euless, TX 76040
Details & Description
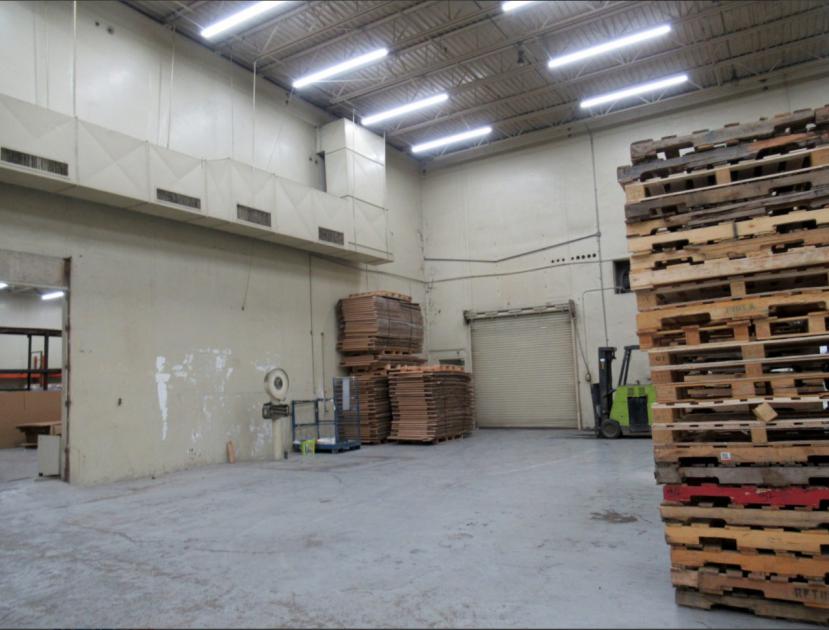
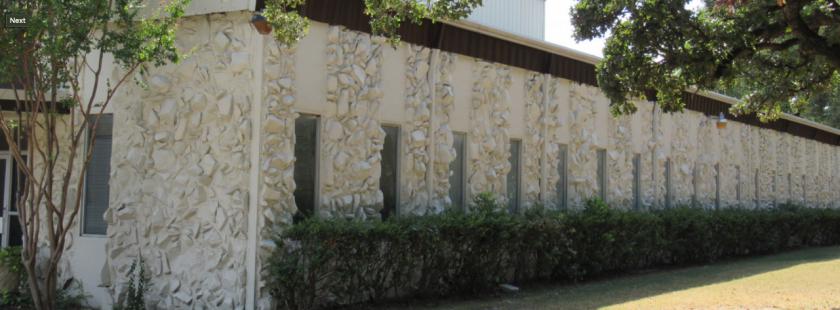
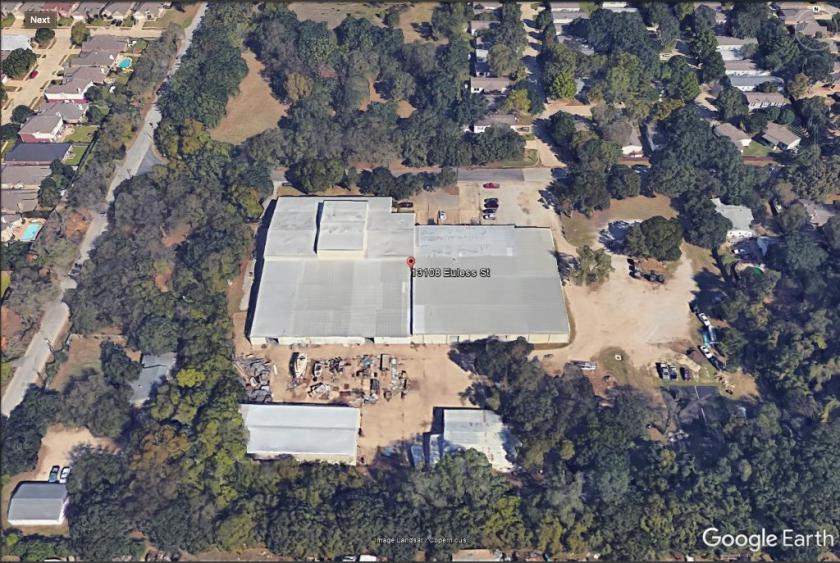
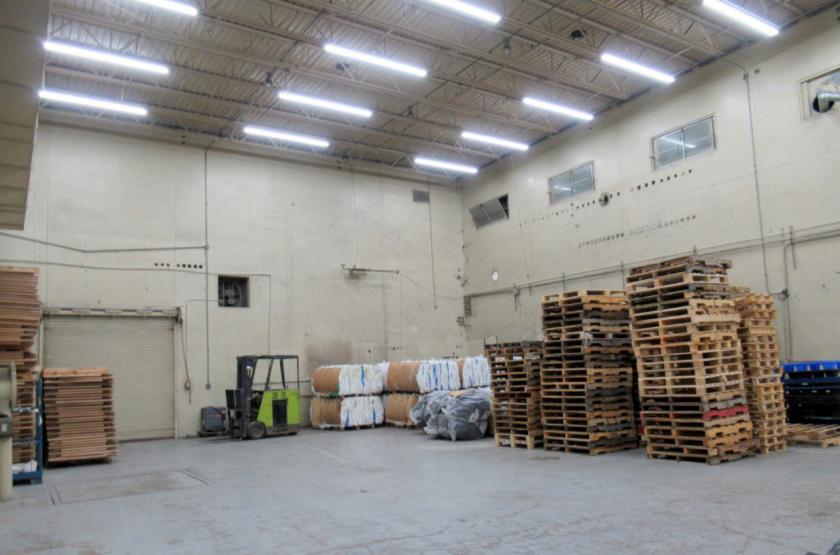
Additional Photos

Listing Agents

Nancy Halliday
O: 214-850-0730
nhalliday@henrysmiller.com
O: 214-850-0730
nhalliday@henrysmiller.com
While we strive to provide the most accurate information, all listing information, and demographic data, is provided by third-parties. As such, MyEListing will not be responsible for the accuracy of the information. It is strongly recommended that you verify all information with the listing agent, and any relevant agencies, prior to making any decisions.


