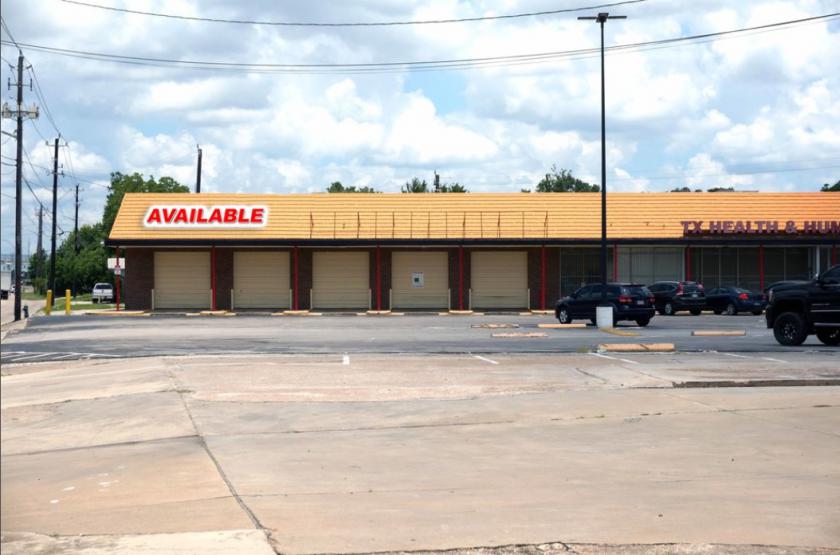
1-Mile | 3-Miles | 5-Miles | ||
---|---|---|---|---|
Total Population | 13,430 | 122,055 | 294,764 | |
Population Median Age | 31 | 32 | 34 | |
Population by Age | 0-9 Yrs | 2555 (19%) | 21540 (17%) | 49701 (16%) |
10-19 Yrs | 2262 (16%) | 20514 (16%) | 45655 (15%) | |
20-29 Yrs | 2144 (15%) | 18550 (15%) | 42867 (14%) | |
30-39 Yrs | 1898 (14%) | 17288 (14%) | 42673 (14%) | |
40-49 Yrs | 1513 (11%) | 15273 (12%) | 36051 (12%) | |
50-59 Yrs | 1503 (11%) | 13532 (11%) | 34594 (11%) | |
60-69 Yrs | 1040 (7%) | 8985 (7%) | 23973 (8%) | |
70+ Yrs | 514 (3%) | 6373 (5%) | 19250 (6%) | |
Median HH Income | $40,661 | $35,589 | $37,417 | |
Total Household Income | < 24K | 942 (26%) | 11255 (32%) | 28975 (32%) |
25-49K | 1311 (36%) | 11318 (33%) | 26778 (30%) | |
50-74K | 770 (21%) | 6300 (18%) | 14606 (16%) | |
75-99K | 361 (10%) | 3031 (8%) | 8341 (9%) | |
100-199K | 156 (4%) | 2100 (6%) | 8212 (9%) | |
200K+ | 6 (0%) | 133 (0%) | 2196 (2%) | |
Highest Education Level | No Diploma | 3741 | 36523 | 73011 |
Diploma or GED | 2681 | 21449 | 53075 | |
Some College | 790 | 8110 | 26473 | |
Assoc. Degree | 142 | 1817 | 6616 | |
Bachelors Degree | 198 | 2031 | 12416 | |
Higher Degree | 59 | 521 | 6382 | |
Total Housing Units | 3,831 | 37,394 | 99,155 | |
--Owner-Occupied | 2,170 | 19,098 | 49,731 | |
--Renter-Occupied | 1,376 | 15,039 | 39,378 | |
Owner-Occupied Values | < 100K | 1333 | 11155 | 26802 |
100-199K | 742 | 7048 | 15203 | |
200-299K | 57 | 650 | 2977 | |
300-399K | 9 | 129 | 1601 | |
400-499K | 0 | 6 | 1169 | |
500K+ | 29 | 111 | 1978 | |
Total Working Age Population | 9,565 | 87,959 | 216,520 | |
In Work Force | 6,001 | 52,703 | 130,917 | |
Not In Work Force | 3,565 | 35,256 | 85,603 | |
Workforce Employed | 5,852 | 50,246 | 122,660 | |
Workforce Unemployed | 149 | 2,457 | 8,249 | |
Civlian Workforce | 6,001 | 52,703 | 130,909 | |
Military Workforce | 0 | 0 | 8 | |
Total Households | 3,546 | 34,137 | 89,108 | |
Family Households | 2,813 | 25,946 | 64,228 | |
Non-Family Households | 733 | 8,191 | 24,880 | |
Married Couple | 1,620 | 14,930 | 35,951 | |
Other Family | 1,192 | 11,016 | 28,278 | |
Married w/Child | 897 | 7,442 | 16,795 | |
Single Male w/Child | 152 | 1,579 | 3,800 | |
Single Female w/Child | 438 | 4,815 | 10,945 |
Population Change Last Two Decades - Plus Projection
2000 | % | 2010 | % | 2020 | % | 2030 | |
---|---|---|---|---|---|---|---|
Texas | 20,851,820 | +21 | 25,145,561 | +18 | 29,677,668 | +18 | 34,894,452 |
Harris County | 3,400,578 | +20 | 4,092,459 | +22 | 4,978,845 | +19 | 5,924,750 |
Total Working Age Population:
Total Households:
Total Working Age Population:
Total Households:
Total Working Age Population:
Total Households: