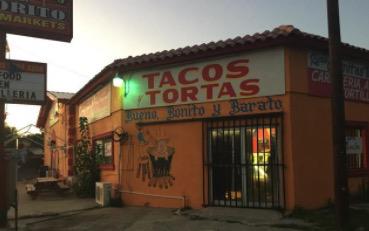
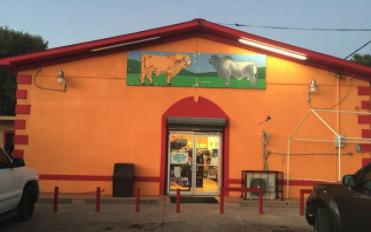
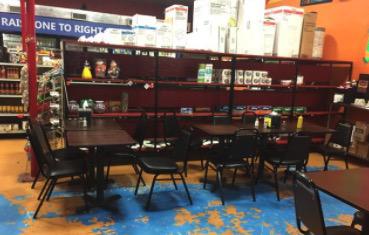
1-Mile | 3-Miles | 5-Miles | ||
---|---|---|---|---|
Total Population | 6,788 | 62,516 | 141,586 | |
Population Median Age | 36 | 36 | 36 | |
Population by Age | 0-9 Yrs | 712 (10%) | 8229 (13%) | 19147 (13%) |
10-19 Yrs | 1252 (18%) | 10691 (17%) | 22053 (15%) | |
20-29 Yrs | 909 (13%) | 7227 (11%) | 16683 (11%) | |
30-39 Yrs | 1029 (15%) | 8893 (14%) | 18989 (13%) | |
40-49 Yrs | 1120 (16%) | 10434 (16%) | 22686 (16%) | |
50-59 Yrs | 743 (10%) | 7689 (12%) | 17895 (12%) | |
60-69 Yrs | 599 (8%) | 5293 (8%) | 13084 (9%) | |
70+ Yrs | 422 (6%) | 4061 (6%) | 11050 (7%) | |
Median HH Income | $90,695 | $99,777 | $93,993 | |
Total Household Income | < 24K | 212 (8%) | 1757 (8%) | 4238 (8%) |
25-49K | 316 (12%) | 2775 (13%) | 7420 (14%) | |
50-74K | 436 (17%) | 3047 (14%) | 7854 (15%) | |
75-99K | 409 (16%) | 3042 (14%) | 7063 (14%) | |
100-199K | 758 (31%) | 7495 (35%) | 16715 (33%) | |
200K+ | 312 (12%) | 3073 (14%) | 6467 (12%) | |
Highest Education Level | No Diploma | 104 | 1501 | 3476 |
Diploma or GED | 447 | 5202 | 13317 | |
Some College | 803 | 8506 | 19417 | |
Assoc. Degree | 633 | 3432 | 7779 | |
Bachelors Degree | 1557 | 13204 | 29892 | |
Higher Degree | 910 | 8519 | 18795 | |
Total Housing Units | 2,608 | 22,612 | 52,560 | |
--Owner-Occupied | 1,393 | 14,766 | 35,072 | |
--Renter-Occupied | 1,050 | 6,424 | 14,686 | |
Owner-Occupied Values | < 100K | 65 | 332 | 1031 |
100-199K | 107 | 1801 | 5804 | |
200-299K | 684 | 6236 | 14755 | |
300-399K | 228 | 3395 | 7362 | |
400-499K | 154 | 1661 | 3452 | |
500K+ | 154 | 1341 | 2667 | |
Total Working Age Population | 5,313 | 47,572 | 108,292 | |
In Work Force | 3,615 | 31,928 | 73,222 | |
Not In Work Force | 1,698 | 15,644 | 35,070 | |
Workforce Employed | 3,464 | 30,327 | 69,571 | |
Workforce Unemployed | 96 | 1,227 | 2,864 | |
Civlian Workforce | 3,560 | 31,554 | 72,435 | |
Military Workforce | 55 | 374 | 787 | |
Total Households | 2,443 | 21,190 | 49,758 | |
Family Households | 1,619 | 15,272 | 35,359 | |
Non-Family Households | 824 | 5,918 | 14,399 | |
Married Couple | 1,302 | 13,122 | 29,973 | |
Other Family | 317 | 2,151 | 5,386 | |
Married w/Child | 650 | 6,734 | 14,243 | |
Single Male w/Child | 33 | 345 | 792 | |
Single Female w/Child | 179 | 983 | 2,436 |
Population Change Last Two Decades - Plus Projection
2000 | % | 2010 | % | 2020 | % | 2030 | |
---|---|---|---|---|---|---|---|
Texas | 20,851,820 | +21 | 25,145,561 | +18 | 29,677,668 | +18 | 34,894,452 |
Bexar County | 1,392,931 | +23 | 1,714,773 | +22 | 2,093,502 | +20 | 2,502,617 |
Comal County | 78,021 | +39 | 108,472 | +36 | 147,330 | +39 | 204,873 |
Total Working Age Population:
Total Households:
Total Working Age Population:
Total Households:
Total Working Age Population:
Total Households: