Description
This piece of land is located in the municipality of Hidalgo, TX, located in the greater McAllen MSA. The land is ideally located in the heart of the industrial market, and right across the street from the State Farm Arena.
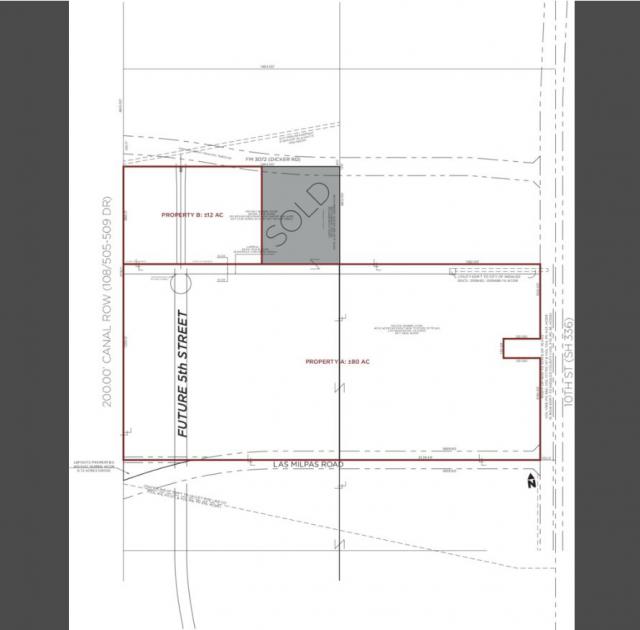
Highlights ±92 total acres available
Property A: ±80 acres
Property B: ±12 acres
10 acre minimum
Adjacent to the State Farm Arena
Ideal for mixed use development - including strip center, multi-family, storage units, or industrial
Zoned commercial & light industrial
Property is in agricultural tax exemption
No part of this information may be copied, reproduced, repurposed, or screen-captured for any commercial purpose without prior written authorization from MyEListing.
While we strive to provide the most accurate information, all listing information, and demographic data, is provided by third-parties. As such, MyEListing will not be responsible for the accuracy of the information. It is strongly recommended that you verify all information with the listing agent, and any relevant agencies, prior to making any decisions.
What is the asking price for Las Milpas Rd in Hidalgo?
The asking price for Las Milpas Rd is $45,000
How much land does the Hidalgo, TX property at Las Milpas Rd include?
Las Milpas Rd in Hidalgo includes 92.000 acres of land
What is the population within 1 mile of Las Milpas Rd in Hidalgo?
The population within 1 mile of Las Milpas Rd Hidalgo, TX 78557 is 967 people.
Who do I contact for questions about Las Milpas Rd?
You should contact the listing agent,
Edward Villareal, for any details regarding this commercial listing.