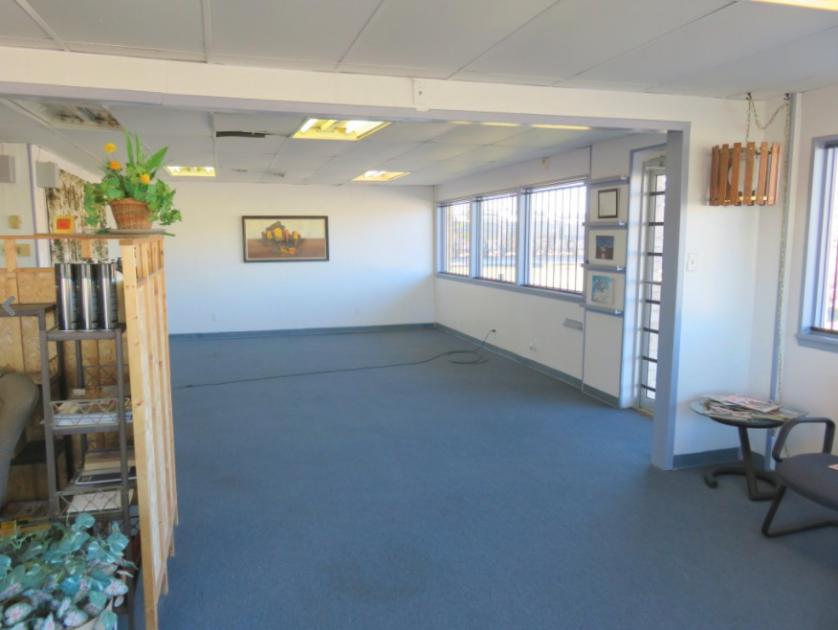
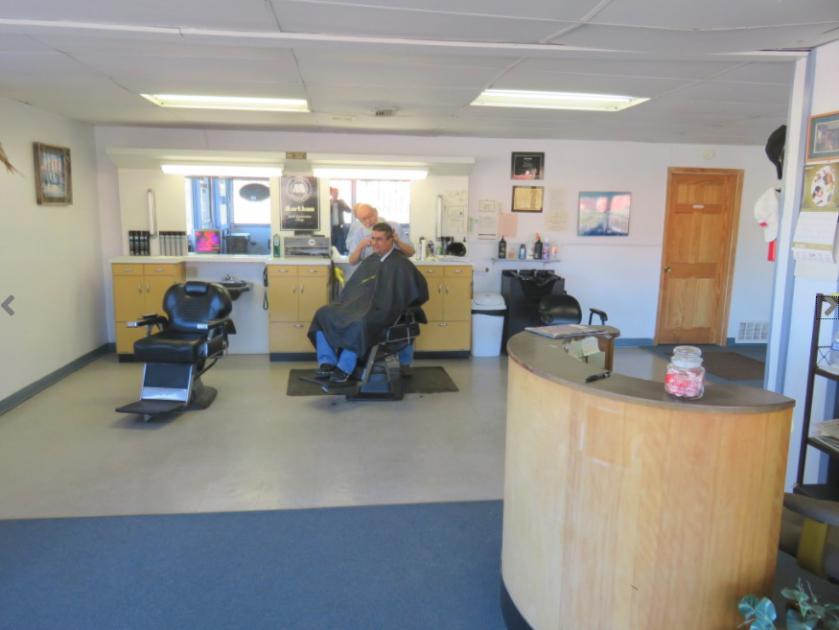
1-Mile | 3-Miles | 5-Miles | ||
---|---|---|---|---|
Total Population | 16,294 | 75,899 | 157,542 | |
Population Median Age | 34 | 37 | 38 | |
Population by Age | 0-9 Yrs | 3006 (18%) | 11286 (14%) | 21232 (13%) |
10-19 Yrs | 2073 (12%) | 8632 (11%) | 17453 (11%) | |
20-29 Yrs | 3248 (19%) | 12900 (16%) | 25835 (16%) | |
30-39 Yrs | 2019 (12%) | 10999 (14%) | 23295 (14%) | |
40-49 Yrs | 1305 (8%) | 8008 (10%) | 17548 (11%) | |
50-59 Yrs | 1952 (11%) | 9323 (12%) | 20006 (12%) | |
60-69 Yrs | 1524 (9%) | 7689 (10%) | 17052 (10%) | |
70+ Yrs | 1166 (7%) | 7063 (9%) | 15122 (9%) | |
Median HH Income | $36,717 | $51,465 | $58,634 | |
Total Household Income | < 24K | 2008 (31%) | 7414 (24%) | 12476 (19%) |
25-49K | 2041 (31%) | 7533 (24%) | 14984 (23%) | |
50-74K | 955 (14%) | 5674 (18%) | 12178 (18%) | |
75-99K | 788 (12%) | 3392 (11%) | 7662 (11%) | |
100-199K | 549 (8%) | 5002 (16%) | 12046 (18%) | |
200K+ | 86 (1%) | 1597 (5%) | 4815 (7%) | |
Highest Education Level | No Diploma | 1854 | 7313 | 12408 |
Diploma or GED | 3062 | 13759 | 27204 | |
Some College | 2734 | 11942 | 24469 | |
Assoc. Degree | 734 | 3585 | 7304 | |
Bachelors Degree | 1087 | 9394 | 23214 | |
Higher Degree | 413 | 4638 | 13562 | |
Total Housing Units | 7,658 | 34,449 | 71,362 | |
--Owner-Occupied | 1,883 | 13,491 | 32,258 | |
--Renter-Occupied | 4,544 | 17,120 | 31,904 | |
Owner-Occupied Values | < 100K | 548 | 3687 | 7475 |
100-199K | 1138 | 5250 | 12115 | |
200-299K | 167 | 1982 | 4403 | |
300-399K | 14 | 1106 | 3015 | |
400-499K | 0 | 505 | 1717 | |
500K+ | 16 | 961 | 3533 | |
Total Working Age Population | 12,157 | 59,513 | 125,674 | |
In Work Force | 8,144 | 39,609 | 83,145 | |
Not In Work Force | 4,013 | 19,905 | 42,529 | |
Workforce Employed | 7,286 | 36,667 | 77,830 | |
Workforce Unemployed | 849 | 2,842 | 4,804 | |
Civlian Workforce | 8,135 | 39,509 | 82,634 | |
Military Workforce | 9 | 99 | 511 | |
Total Households | 6,427 | 30,611 | 64,162 | |
Family Households | 3,486 | 17,365 | 36,957 | |
Non-Family Households | 2,941 | 13,246 | 27,205 | |
Married Couple | 1,977 | 11,868 | 26,518 | |
Other Family | 1,509 | 5,497 | 10,439 | |
Married w/Child | 1,015 | 5,321 | 11,112 | |
Single Male w/Child | 127 | 563 | 1,072 | |
Single Female w/Child | 792 | 2,517 | 4,621 |
Population Change Last Two Decades - Plus Projection
2000 | % | 2010 | % | 2020 | % | 2030 | |
---|---|---|---|---|---|---|---|
Texas | 20,851,820 | +21 | 25,145,561 | +18 | 29,677,668 | +18 | 34,894,452 |
Tarrant County | 1,446,219 | +25 | 1,809,034 | +19 | 2,143,755 | +17 | 2,507,170 |
Total Working Age Population:
Total Households:
Total Working Age Population:
Total Households:
Total Working Age Population:
Total Households: