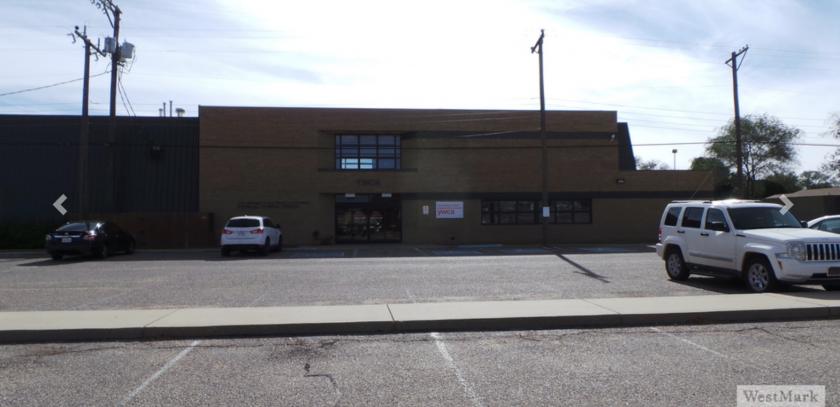
1-Mile | 3-Miles | 5-Miles | ||
---|---|---|---|---|
Total Population | 15,206 | 116,903 | 214,352 | |
Population Median Age | 33 | 34 | 35 | |
Population by Age | 0-9 Yrs | 1414 (9%) | 13368 (11%) | 26542 (12%) |
10-19 Yrs | 1564 (10%) | 20368 (17%) | 33131 (15%) | |
20-29 Yrs | 5903 (38%) | 30177 (25%) | 50170 (23%) | |
30-39 Yrs | 1853 (12%) | 13587 (11%) | 26672 (12%) | |
40-49 Yrs | 1041 (6%) | 9959 (8%) | 20148 (9%) | |
50-59 Yrs | 1242 (8%) | 10932 (9%) | 21975 (10%) | |
60-69 Yrs | 1192 (7%) | 8993 (7%) | 17906 (8%) | |
70+ Yrs | 997 (6%) | 9518 (8%) | 17807 (8%) | |
Median HH Income | $39,441 | $42,036 | $46,464 | |
Total Household Income | < 24K | 2082 (34%) | 13180 (30%) | 22155 (27%) |
25-49K | 1545 (25%) | 11853 (27%) | 21769 (26%) | |
50-74K | 947 (15%) | 7508 (17%) | 14288 (17%) | |
75-99K | 611 (10%) | 4173 (9%) | 9233 (11%) | |
100-199K | 677 (11%) | 4866 (11%) | 11546 (14%) | |
200K+ | 149 (2%) | 1217 (2%) | 2816 (3%) | |
Highest Education Level | No Diploma | 867 | 11486 | 17741 |
Diploma or GED | 1759 | 16631 | 31409 | |
Some College | 1958 | 14628 | 29944 | |
Assoc. Degree | 473 | 3364 | 7646 | |
Bachelors Degree | 1317 | 9807 | 21953 | |
Higher Degree | 1246 | 6601 | 13712 | |
Total Housing Units | 6,921 | 48,437 | 91,758 | |
--Owner-Occupied | 2,500 | 19,698 | 39,962 | |
--Renter-Occupied | 3,511 | 23,099 | 41,845 | |
Owner-Occupied Values | < 100K | 1118 | 8794 | 14274 |
100-199K | 934 | 8025 | 17327 | |
200-299K | 243 | 1532 | 4674 | |
300-399K | 138 | 553 | 1833 | |
400-499K | 31 | 365 | 871 | |
500K+ | 37 | 429 | 983 | |
Total Working Age Population | 12,806 | 95,021 | 171,331 | |
In Work Force | 8,155 | 59,264 | 111,669 | |
Not In Work Force | 4,651 | 35,758 | 59,662 | |
Workforce Employed | 7,931 | 56,394 | 106,811 | |
Workforce Unemployed | 224 | 2,847 | 4,746 | |
Civlian Workforce | 8,155 | 59,241 | 111,557 | |
Military Workforce | 0 | 23 | 111 | |
Total Households | 6,012 | 42,797 | 81,807 | |
Family Households | 2,736 | 23,889 | 47,936 | |
Non-Family Households | 3,276 | 18,909 | 33,872 | |
Married Couple | 1,747 | 15,077 | 31,475 | |
Other Family | 988 | 8,812 | 16,460 | |
Married w/Child | 739 | 6,004 | 12,425 | |
Single Male w/Child | 106 | 1,438 | 2,353 | |
Single Female w/Child | 268 | 3,087 | 6,438 |
Population Change Last Two Decades - Plus Projection
2000 | % | 2010 | % | 2020 | % | 2030 | |
---|---|---|---|---|---|---|---|
Texas | 20,851,820 | +21 | 25,145,561 | +18 | 29,677,668 | +18 | 34,894,452 |
Lubbock County | 242,628 | +15 | 278,831 | +14 | 317,210 | +16 | 367,552 |
Total Working Age Population:
Total Households:
Total Working Age Population:
Total Households:
Total Working Age Population:
Total Households: