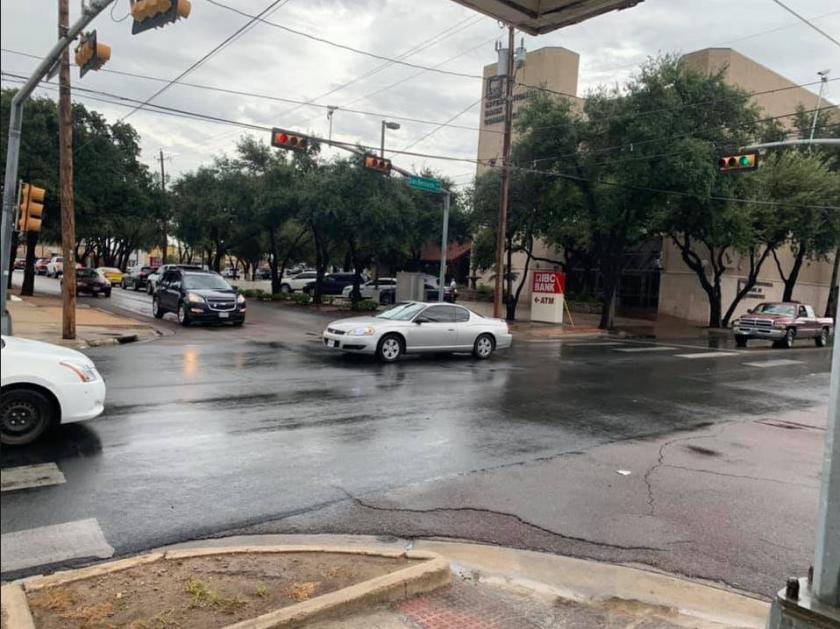
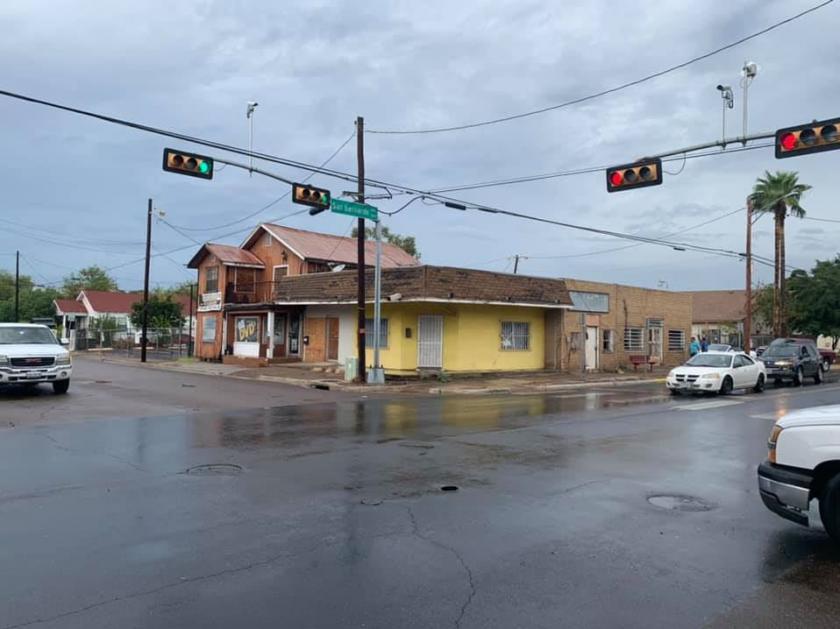
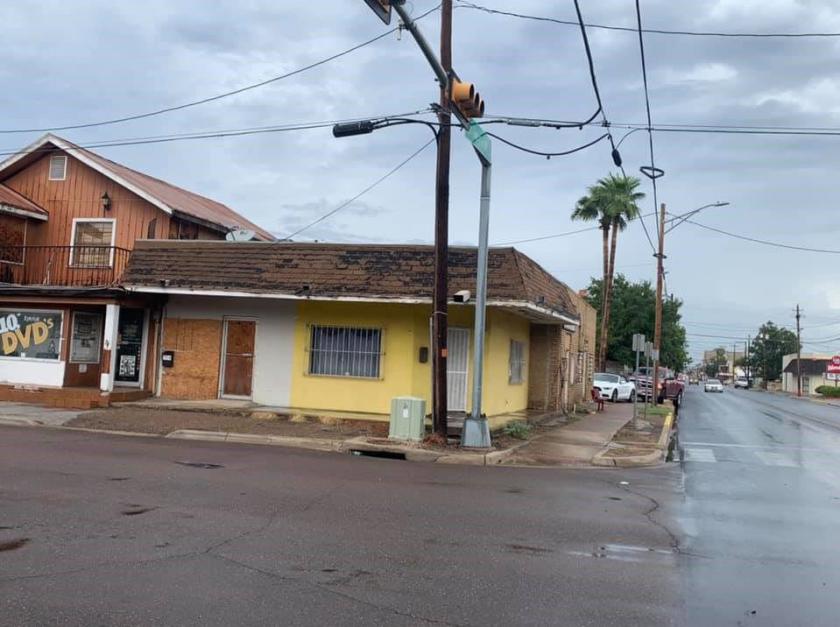
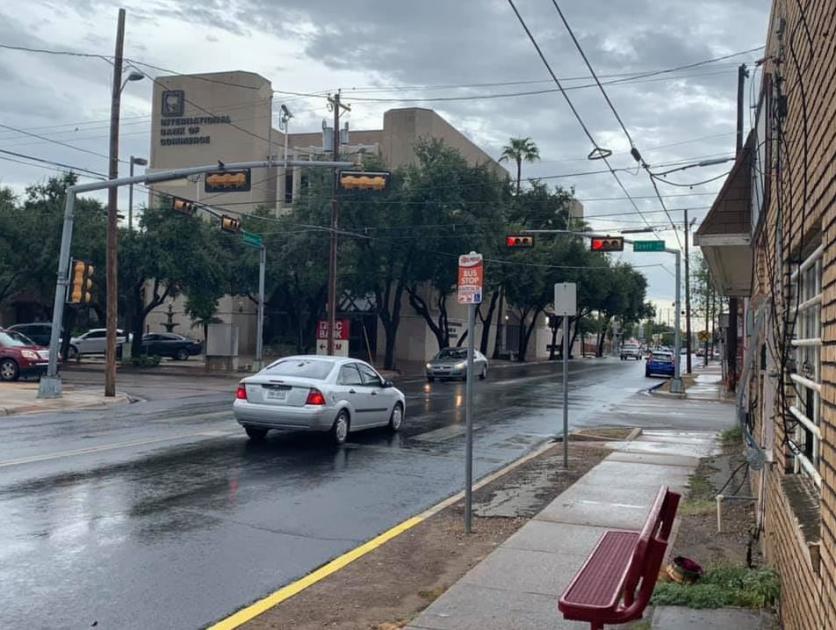
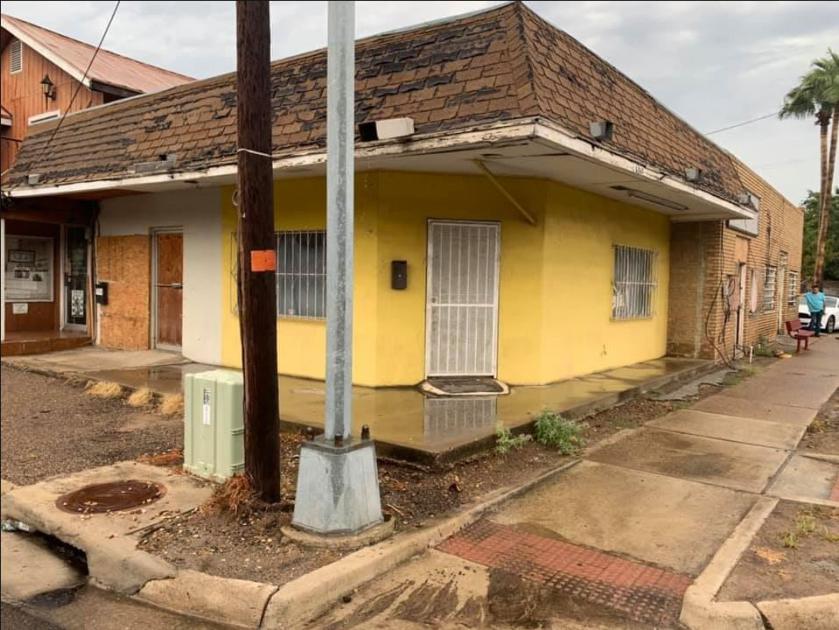
Retail Space
1306 San Bernardo Ave Laredo, TX 78040
1306 San Bernardo Ave Laredo, TX 78040
Details & Description
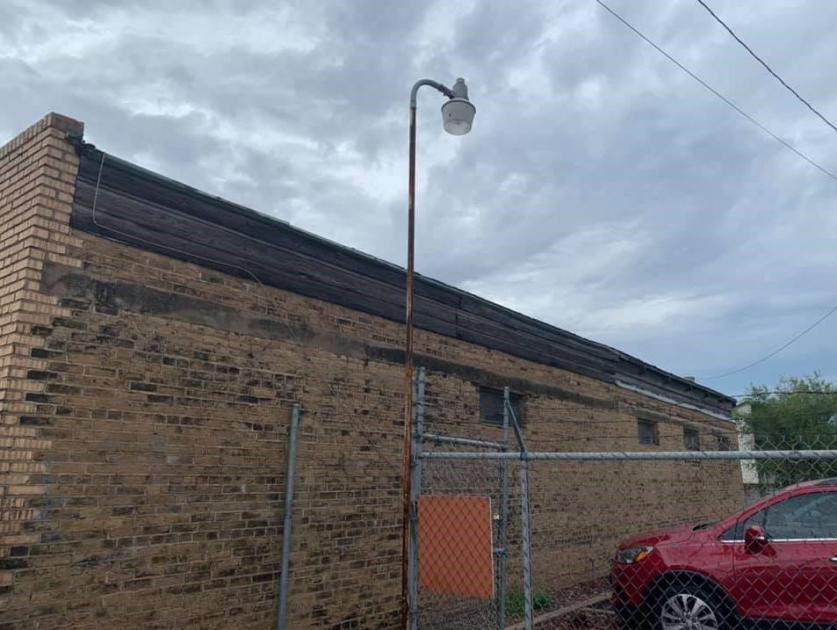
Additional Photos
Listing Agents

Mario Zaragoza
Exclusive Broker & Realty, LLC
O: 956-282-9675
mariozaragoza@yahoo.com
Exclusive Broker & Realty, LLC
O: 956-282-9675
mariozaragoza@yahoo.com
While we strive to provide the most accurate information, all listing information, and demographic data, is provided by third-parties. As such, MyEListing will not be responsible for the accuracy of the information. It is strongly recommended that you verify all information with the listing agent, and any relevant agencies, prior to making any decisions.