Description
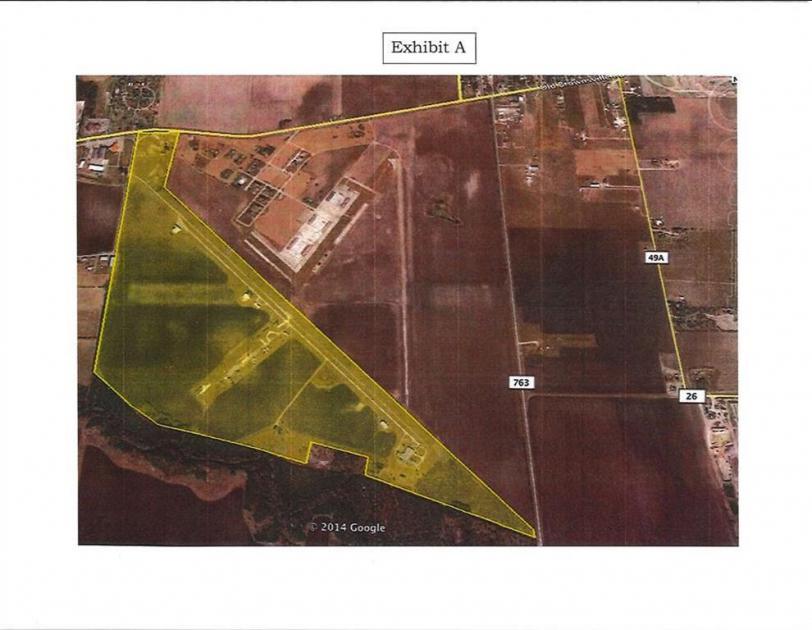
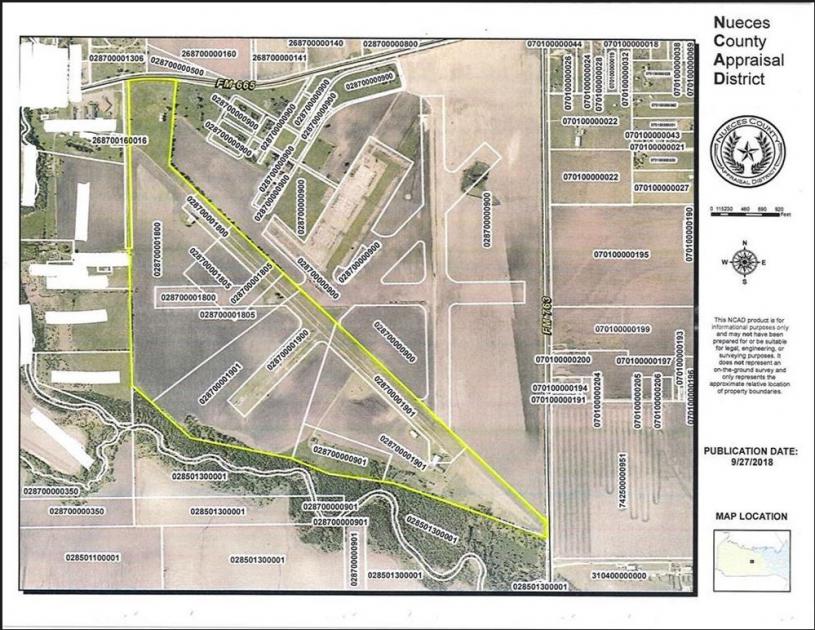
TAKE A CLOSER LOOK...DO IT! DO IT! DO IT! - - In Nueces County, outside city limits - You are looking at approximately 260 acres of land. Has access off of Old Brownsville Road CR 763(approx 75FF) - Pre Engineered metal warehouse approx 6,000-7,000 sq ft - Former Airplane hangar, currently used for storage - One runway was used in the original Cuddihy Field (poor condition) - Approx. 20,000 sq ft concrete block building, was men's dormitory with a full kitchen, rest room, bank style dorm rooms - Connected to a working water plant, fresh water lines, electrical lines throughout - 3 other metal buildings, approx 2,000 - 3,000 sq ft each in poor condition - Old mobile homes-scrap value - across the street from Memory Gardens Cemetery. USAGE: Good use for farming, possible residential development site, Industrial Park.
Features
Property Type: Residential Lots & Land
Sub Type: Residential Lots & Land
Listing Status: Active
County/Area: Nueces County
Zip Code: 78401
Subdivision/Neighborhood: Assessors Map 155
Elementary School: West Oso
Middle School: West Oso
High School: West Oso
Lot Size: 260 acres
High School District: West Oso Isd
Lot Size Source: Appraiser
Lot Size Square Feet: 3049200
Main Type: Land
Middle Or Junior School District: West Oso Isd
Postal City: Corpus Christi
Utilities: Other, Phone Available
No part of this information may be copied, reproduced, repurposed, or screen-captured for any commercial purpose without prior written authorization from MyEListing.
While we strive to provide the most accurate information, all listing information, and demographic data, is provided by third-parties. As such, MyEListing will not be responsible for the accuracy of the information. It is strongly recommended that you verify all information with the listing agent, and any relevant agencies, prior to making any decisions.
What is the asking price for 1355 FM RD 665 Old Brownsville Rd in Corpus Christi?
The asking price for 1355 FM RD 665 Old Brownsville Rd is $1,500,000
How much land does the Corpus Christi, TX property at 1355 FM RD 665 Old Brownsville Rd include?
1355 FM RD 665 Old Brownsville Rd in Corpus Christi includes 260.000 acres of land
What is the population within 1 mile of 1355 FM RD 665 Old Brownsville Rd in Corpus Christi?
The population within 1 mile of 1355 FM RD 665 Old Brownsville Rd Corpus Christi, TX 78415 is 155 people.
Who do I contact for questions about 1355 FM RD 665 Old Brownsville Rd?
You should contact the listing agent,
Dalia Cortez, for any details regarding this commercial listing.