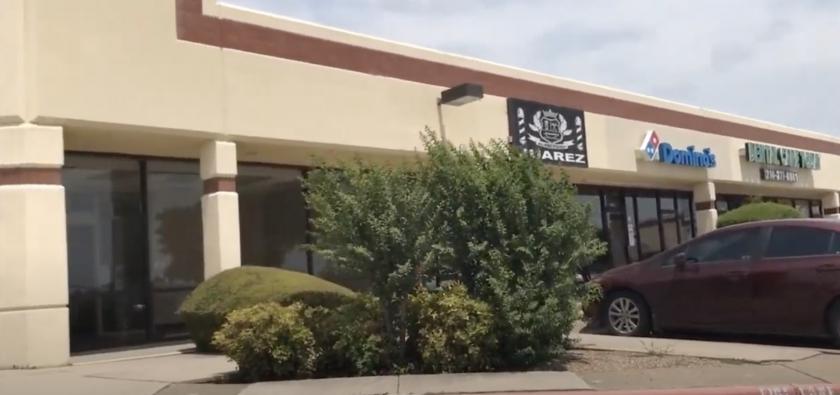
1-Mile | 3-Miles | 5-Miles | ||
---|---|---|---|---|
Total Population | 8,509 | 105,861 | 360,683 | |
Population Median Age | 41 | 39 | 36 | |
Population by Age | 0-9 Yrs | 1067 (12%) | 12209 (11%) | 50560 (14%) |
10-19 Yrs | 593 (6%) | 11868 (11%) | 46973 (13%) | |
20-29 Yrs | 1118 (13%) | 16059 (15%) | 58457 (16%) | |
30-39 Yrs | 1544 (18%) | 15290 (14%) | 53305 (14%) | |
40-49 Yrs | 791 (9%) | 12955 (12%) | 45409 (12%) | |
50-59 Yrs | 1296 (15%) | 13997 (13%) | 43811 (12%) | |
60-69 Yrs | 1176 (13%) | 12823 (12%) | 33408 (9%) | |
70+ Yrs | 923 (10%) | 10660 (10%) | 28759 (7%) | |
Median HH Income | $91,291 | $72,831 | $60,415 | |
Total Household Income | < 24K | 231 (6%) | 5472 (13%) | 23338 (18%) |
25-49K | 541 (15%) | 7801 (19%) | 30289 (23%) | |
50-74K | 683 (19%) | 7798 (19%) | 23385 (18%) | |
75-99K | 482 (13%) | 5783 (14%) | 15558 (12%) | |
100-199K | 1399 (39%) | 10994 (26%) | 28463 (21%) | |
200K+ | 202 (5%) | 3085 (7%) | 8420 (6%) | |
Highest Education Level | No Diploma | 274 | 6968 | 37159 |
Diploma or GED | 1120 | 10786 | 41946 | |
Some College | 1248 | 16422 | 48605 | |
Assoc. Degree | 475 | 5104 | 15708 | |
Bachelors Degree | 2349 | 23090 | 60122 | |
Higher Degree | 999 | 11611 | 30707 | |
Total Housing Units | 3,764 | 43,304 | 139,087 | |
--Owner-Occupied | 2,393 | 24,570 | 65,004 | |
--Renter-Occupied | 1,145 | 16,363 | 64,450 | |
Owner-Occupied Values | < 100K | 34 | 1316 | 5295 |
100-199K | 889 | 10175 | 25041 | |
200-299K | 1131 | 7584 | 18215 | |
300-399K | 244 | 3052 | 9402 | |
400-499K | 48 | 1501 | 4186 | |
500K+ | 47 | 942 | 2865 | |
Total Working Age Population | 7,071 | 86,495 | 282,245 | |
In Work Force | 5,040 | 58,549 | 195,549 | |
Not In Work Force | 2,031 | 27,946 | 86,697 | |
Workforce Employed | 4,787 | 55,853 | 185,226 | |
Workforce Unemployed | 240 | 2,643 | 10,190 | |
Civlian Workforce | 5,027 | 58,496 | 195,417 | |
Military Workforce | 13 | 54 | 132 | |
Total Households | 3,538 | 40,932 | 129,454 | |
Family Households | 2,315 | 26,822 | 85,365 | |
Non-Family Households | 1,223 | 14,111 | 44,089 | |
Married Couple | 1,889 | 20,341 | 60,056 | |
Other Family | 426 | 6,481 | 25,309 | |
Married w/Child | 602 | 8,025 | 26,807 | |
Single Male w/Child | 1 | 569 | 3,485 | |
Single Female w/Child | 262 | 2,480 | 10,051 |
Population Change Last Two Decades - Plus Projection
2000 | % | 2010 | % | 2020 | % | 2030 | |
---|---|---|---|---|---|---|---|
Texas | 20,851,820 | +21 | 25,145,561 | +18 | 29,677,668 | +18 | 34,894,452 |
Dallas County | 2,218,899 | +7 | 2,368,139 | +15 | 2,734,111 | +14 | 3,106,298 |
Collin County | 491,675 | +59 | 782,341 | +33 | 1,039,369 | +34 | 1,391,461 |
Total Working Age Population:
Total Households:
Total Working Age Population:
Total Households:
Total Working Age Population:
Total Households: