Highlights
Located Along Hi Traffic US 290 Austin-Houston Corridor
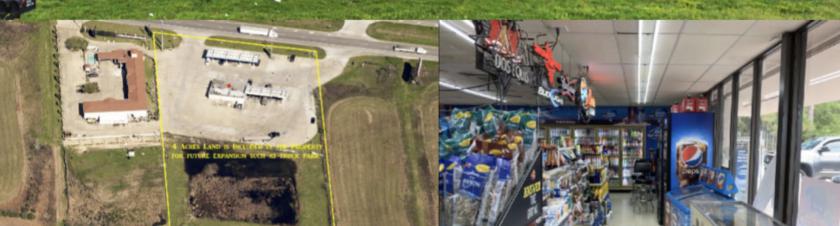
Extra 2 Acres in the rear can be used to Develop Hotel/Motel.
318 ft US 290 frontage provides easy ingress-egress into the gasoline pumps or diesel stations
Absentee owner - opportunity to increase significant inside sales growth month-over-month.
Ideal space to add fast food outfit such as What-a-Burger
22 car parking spaces plus 22 18-wheelers
New logistics center opened in Waller County – RCR Hempstead Logistics Park help feed traffic to the Class 1 railroads like BNSF Railway and Union Pacific Railroad.
Description
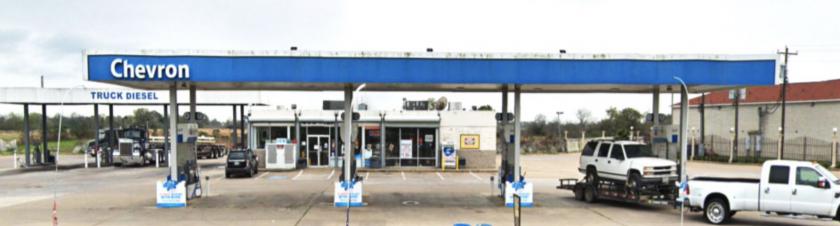
Perfect family business or hands-off business. This world's 5th largest gas station-convenience stores chain, Chevron has 4 Gas pumps stations and 4 Diesel pumps stations built on 2 of the 4 Acres lot on high traffic volume highway US 290. The store has ample acreage room to expand adding fast food brands such as What a burger, Burger King, McDonald etc. Currently has beer, wine and Lottery. Approximately 1200 sf is leased out to Taco outfit with potential rent escalation.
No part of this information may be copied, reproduced, repurposed, or screen-captured for any commercial purpose without prior written authorization from MyEListing.
While we strive to provide the most accurate information, all listing information, and demographic data, is provided by third-parties. As such, MyEListing will not be responsible for the accuracy of the information. It is strongly recommended that you verify all information with the listing agent, and any relevant agencies, prior to making any decisions.
What is the building size of this Retail property in Hempstead, TX?
The size of the building/unit at 51267 Hwy 290 E in Hempstead is 3,191 square feet
How much land does the Hempstead, TX property at 51267 Hwy 290 E include?
51267 Hwy 290 E in Hempstead includes 4.000 acres of land
What is the population within 1 mile of 51267 Hwy 290 E in Hempstead?
The population within 1 mile of 51267 Hwy 290 E Hempstead, TX 77445 is 366 people.
Who do I contact for questions about 51267 Hwy 290 E?
You should contact the listing agent,
Taro Chellaram, for any details regarding this commercial listing.