Office Space
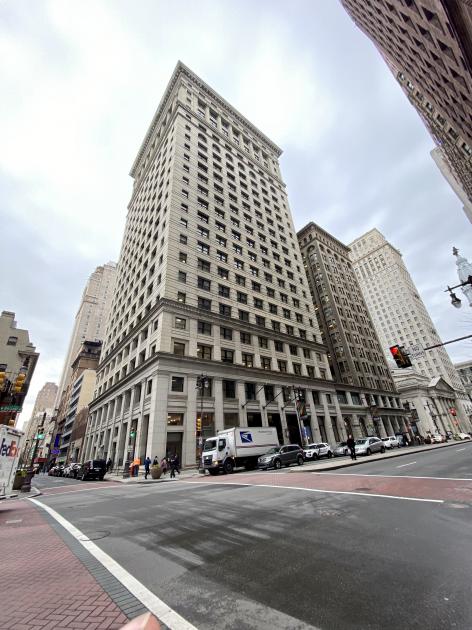
100 S Broad St Philadelphia, PA 19110
100 S Broad St Philadelphia, PA 19110

Details & Description
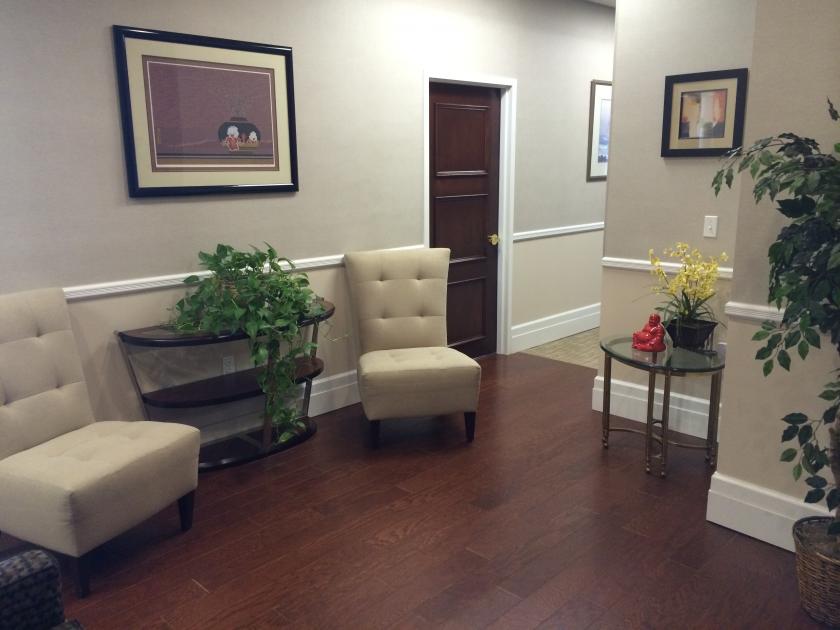
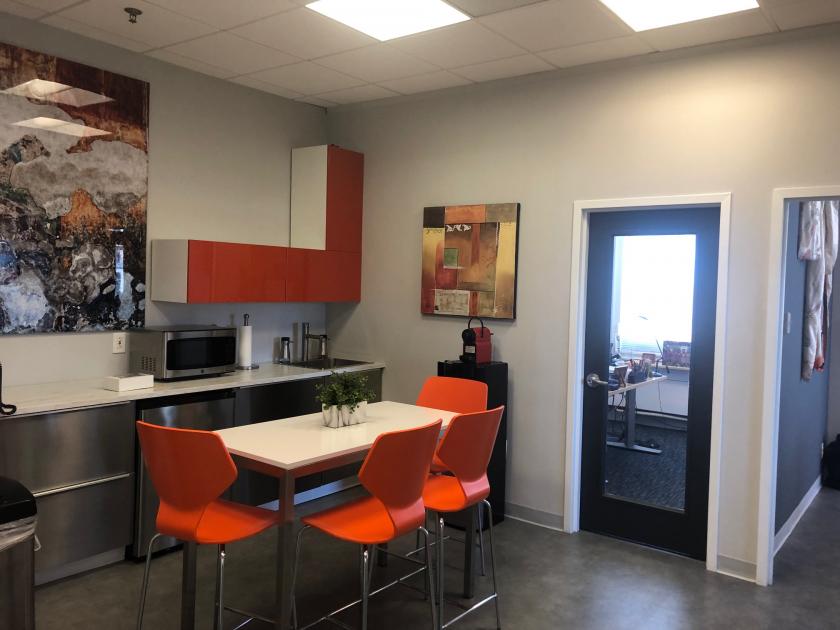
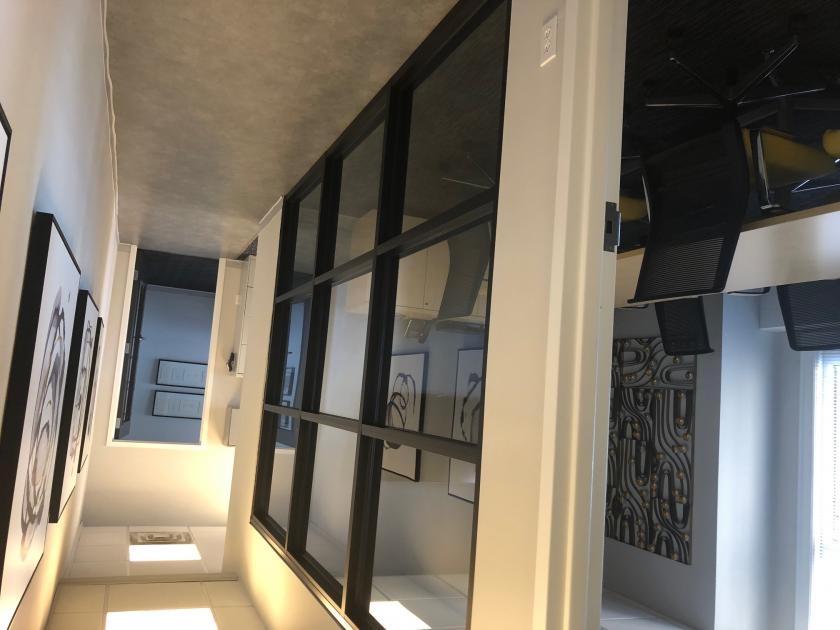
Additional Photos

Listing Agents

Michael S. Fox
O: 215-568-8000
mfox@msfoxre.com
O: 215-568-8000
mfox@msfoxre.com

Mitchell Fox
O: 215-568-8000
mitchfox@msfoxre.com
O: 215-568-8000
mitchfox@msfoxre.com

Brett Fox
O: 215-568-8000
bfox@msfoxre.com
O: 215-568-8000
bfox@msfoxre.com
While we strive to provide the most accurate information, all listing information, and demographic data, is provided by third-parties. As such, MyEListing will not be responsible for the accuracy of the information. It is strongly recommended that you verify all information with the listing agent, and any relevant agencies, prior to making any decisions.