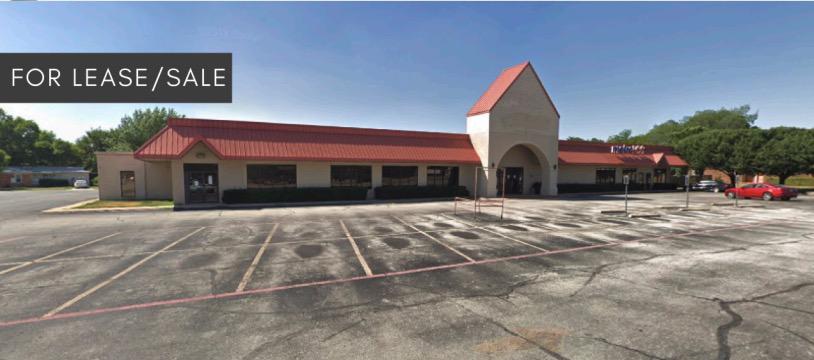
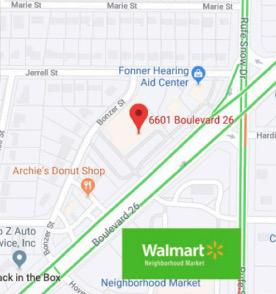
1-Mile | 3-Miles | 5-Miles | ||
---|---|---|---|---|
Total Population | 11,415 | 84,570 | 257,115 | |
Population Median Age | 36 | 36 | 36 | |
Population by Age | 0-9 Yrs | 1960 (17%) | 12131 (14%) | 38349 (14%) |
10-19 Yrs | 1415 (12%) | 11232 (13%) | 34188 (13%) | |
20-29 Yrs | 1786 (15%) | 13031 (15%) | 38741 (15%) | |
30-39 Yrs | 1637 (14%) | 12047 (14%) | 36931 (14%) | |
40-49 Yrs | 1219 (10%) | 10415 (12%) | 33472 (13%) | |
50-59 Yrs | 1160 (10%) | 10160 (12%) | 31392 (12%) | |
60-69 Yrs | 1110 (9%) | 8093 (9%) | 24440 (9%) | |
70+ Yrs | 1129 (9%) | 7461 (8%) | 19602 (7%) | |
Median HH Income | $56,798 | $55,761 | $57,360 | |
Total Household Income | < 24K | 828 (20%) | 4829 (16%) | 15238 (16%) |
25-49K | 870 (21%) | 8150 (27%) | 23781 (26%) | |
50-74K | 1051 (25%) | 6818 (22%) | 19570 (21%) | |
75-99K | 545 (13%) | 4279 (14%) | 12582 (13%) | |
100-199K | 728 (17%) | 5018 (16%) | 17314 (18%) | |
200K+ | 94 (2%) | 794 (2%) | 2767 (3%) | |
Highest Education Level | No Diploma | 1118 | 9165 | 27185 |
Diploma or GED | 2151 | 17017 | 46454 | |
Some College | 1717 | 13633 | 41696 | |
Assoc. Degree | 507 | 3974 | 12056 | |
Bachelors Degree | 1244 | 7951 | 28047 | |
Higher Degree | 415 | 3160 | 11135 | |
Total Housing Units | 4,282 | 32,304 | 98,677 | |
--Owner-Occupied | 2,307 | 16,655 | 53,177 | |
--Renter-Occupied | 1,809 | 13,233 | 38,074 | |
Owner-Occupied Values | < 100K | 687 | 5057 | 14037 |
100-199K | 1128 | 8325 | 27546 | |
200-299K | 406 | 2481 | 8355 | |
300-399K | 54 | 426 | 2071 | |
400-499K | 1 | 205 | 609 | |
500K+ | 31 | 161 | 558 | |
Total Working Age Population | 8,537 | 64,979 | 197,583 | |
In Work Force | 5,785 | 45,123 | 135,979 | |
Not In Work Force | 2,752 | 19,856 | 61,604 | |
Workforce Employed | 5,512 | 42,763 | 128,102 | |
Workforce Unemployed | 272 | 2,311 | 7,780 | |
Civlian Workforce | 5,784 | 45,074 | 135,882 | |
Military Workforce | 1 | 49 | 97 | |
Total Households | 4,115 | 29,888 | 91,251 | |
Family Households | 2,857 | 20,438 | 62,454 | |
Non-Family Households | 1,258 | 9,450 | 28,797 | |
Married Couple | 1,740 | 13,794 | 42,060 | |
Other Family | 1,117 | 6,644 | 20,394 | |
Married w/Child | 607 | 5,753 | 17,527 | |
Single Male w/Child | 287 | 950 | 2,942 | |
Single Female w/Child | 447 | 2,969 | 9,006 |
Population Change Last Two Decades - Plus Projection
2000 | % | 2010 | % | 2020 | % | 2030 | |
---|---|---|---|---|---|---|---|
Texas | 20,851,820 | +21 | 25,145,561 | +18 | 29,677,668 | +18 | 34,894,452 |
Tarrant County | 1,446,219 | +25 | 1,809,034 | +19 | 2,143,755 | +17 | 2,507,170 |
Total Working Age Population:
Total Households:
Total Working Age Population:
Total Households:
Total Working Age Population:
Total Households: