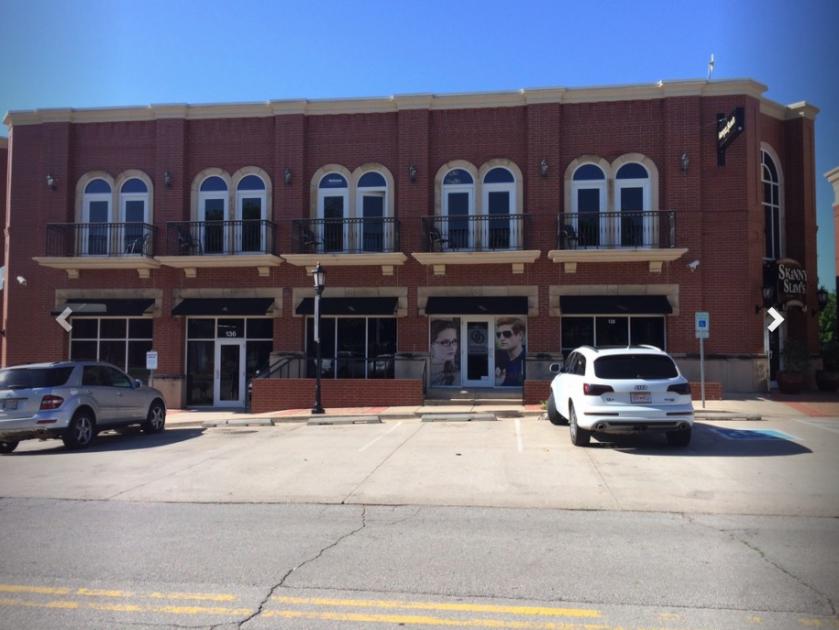
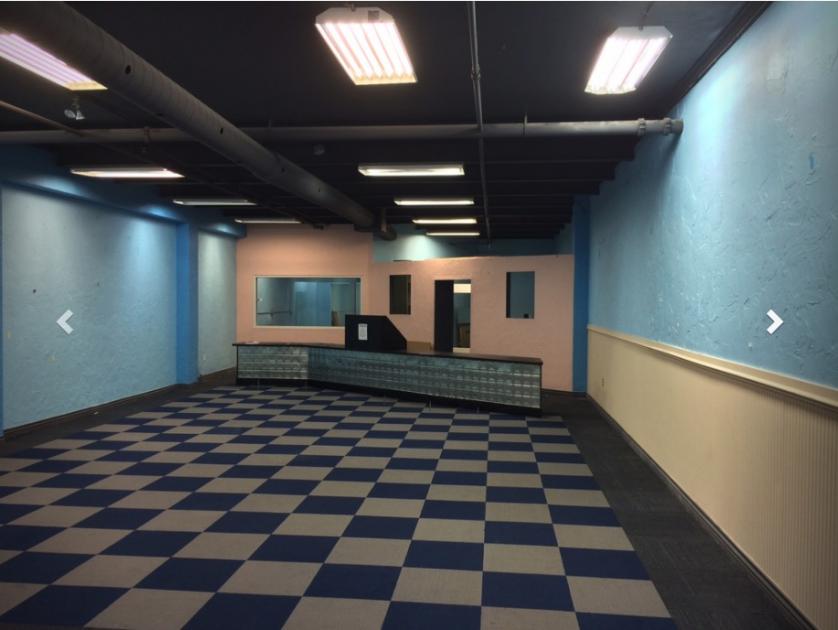
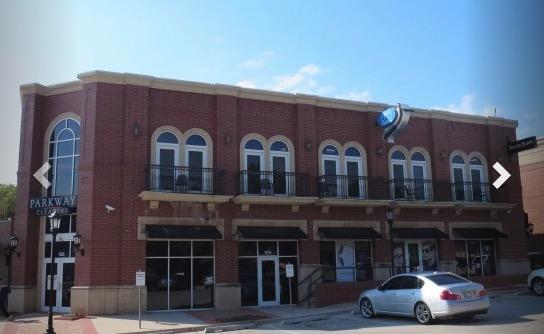
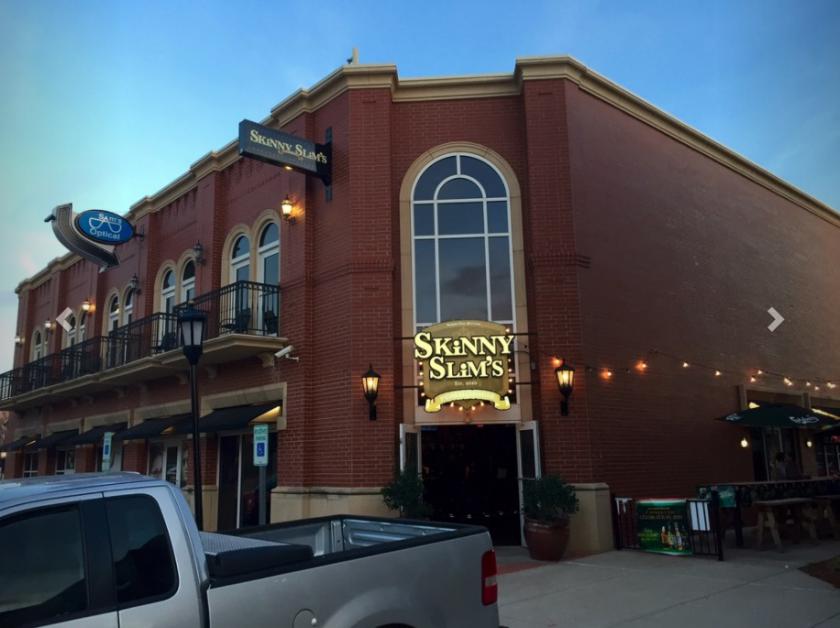
1-Mile | 3-Miles | 5-Miles | ||
---|---|---|---|---|
Total Population | 11,155 | 79,343 | 139,008 | |
Population Median Age | 33 | 36 | 36 | |
Population by Age | 0-9 Yrs | 1418 (12%) | 11451 (14%) | 20581 (14%) |
10-19 Yrs | 1660 (14%) | 11129 (14%) | 19808 (14%) | |
20-29 Yrs | 3116 (27%) | 13563 (17%) | 19801 (14%) | |
30-39 Yrs | 1318 (11%) | 11010 (13%) | 20603 (14%) | |
40-49 Yrs | 1058 (9%) | 8172 (10%) | 16109 (11%) | |
50-59 Yrs | 825 (7%) | 8866 (11%) | 16608 (11%) | |
60-69 Yrs | 784 (7%) | 7819 (9%) | 13217 (9%) | |
70+ Yrs | 977 (8%) | 7333 (9%) | 12282 (8%) | |
Median HH Income | $42,653 | $68,249 | $79,348 | |
Total Household Income | < 24K | 1161 (28%) | 4845 (16%) | 6577 (12%) |
25-49K | 1263 (30%) | 6045 (20%) | 9338 (18%) | |
50-74K | 778 (18%) | 5354 (18%) | 8565 (16%) | |
75-99K | 413 (9%) | 4084 (13%) | 7345 (14%) | |
100-199K | 372 (8%) | 7148 (24%) | 14091 (27%) | |
200K+ | 152 (3%) | 2241 (7%) | 5599 (10%) | |
Highest Education Level | No Diploma | 688 | 1938 | 2936 |
Diploma or GED | 1662 | 8315 | 13570 | |
Some College | 1575 | 11317 | 19056 | |
Assoc. Degree | 481 | 3340 | 5686 | |
Bachelors Degree | 1124 | 14729 | 28675 | |
Higher Degree | 680 | 9625 | 18797 | |
Total Housing Units | 4,682 | 32,176 | 55,253 | |
--Owner-Occupied | 1,496 | 18,346 | 35,347 | |
--Renter-Occupied | 2,644 | 11,370 | 16,168 | |
Owner-Occupied Values | < 100K | 344 | 1221 | 2002 |
100-199K | 830 | 9182 | 14134 | |
200-299K | 239 | 4678 | 9686 | |
300-399K | 21 | 1851 | 4603 | |
400-499K | 34 | 637 | 2008 | |
500K+ | 28 | 777 | 2914 | |
Total Working Age Population | 9,130 | 61,999 | 106,563 | |
In Work Force | 6,365 | 42,048 | 73,118 | |
Not In Work Force | 2,765 | 19,950 | 33,445 | |
Workforce Employed | 5,981 | 40,153 | 70,396 | |
Workforce Unemployed | 358 | 1,690 | 2,384 | |
Civlian Workforce | 6,339 | 41,843 | 72,780 | |
Military Workforce | 26 | 206 | 338 | |
Total Households | 4,140 | 29,716 | 51,515 | |
Family Households | 2,342 | 19,948 | 36,235 | |
Non-Family Households | 1,798 | 9,768 | 15,280 | |
Married Couple | 1,458 | 15,277 | 28,931 | |
Other Family | 884 | 4,671 | 7,304 | |
Married w/Child | 580 | 6,524 | 13,376 | |
Single Male w/Child | 28 | 546 | 1,053 | |
Single Female w/Child | 467 | 2,295 | 3,220 |
Population Change Last Two Decades - Plus Projection
2000 | % | 2010 | % | 2020 | % | 2030 | |
---|---|---|---|---|---|---|---|
Oklahoma | 3,450,654 | +9 | 3,751,351 | +7 | 4,024,202 | +7 | 4,302,501 |
Oklahoma County | 660,448 | +9 | 718,633 | +7 | 772,053 | +6 | 821,230 |
Total Working Age Population:
Total Households:
Total Working Age Population:
Total Households:
Total Working Age Population:
Total Households: