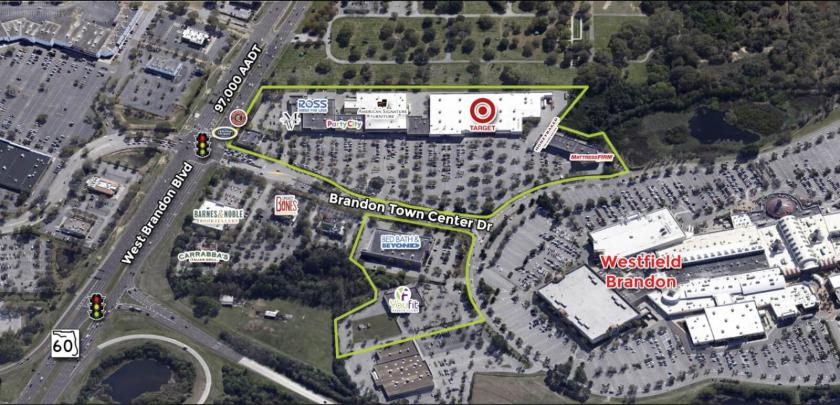
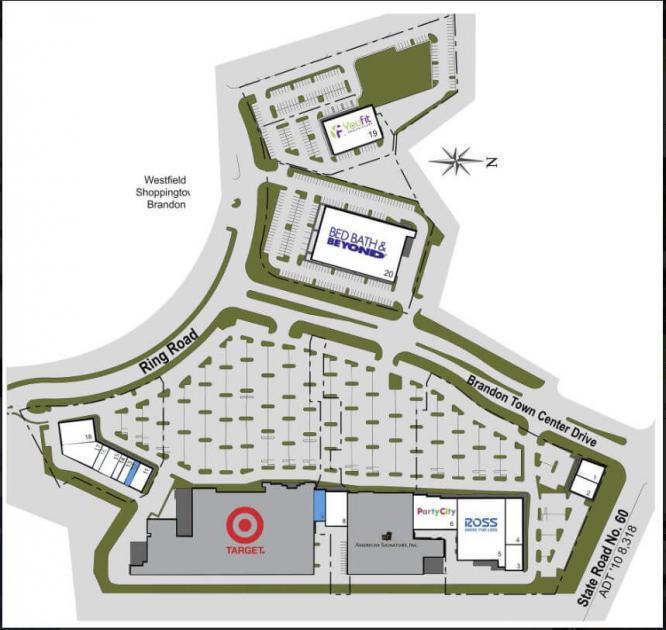
1-Mile | 3-Miles | 5-Miles | ||
---|---|---|---|---|
Total Population | 8,926 | 89,127 | 203,648 | |
Population Median Age | 32 | 36 | 37 | |
Population by Age | 0-9 Yrs | 1162 (13%) | 10874 (12%) | 27037 (13%) |
10-19 Yrs | 1087 (12%) | 10118 (11%) | 25242 (12%) | |
20-29 Yrs | 2210 (24%) | 15932 (17%) | 30800 (15%) | |
30-39 Yrs | 1617 (18%) | 15128 (16%) | 31164 (15%) | |
40-49 Yrs | 1279 (14%) | 11989 (13%) | 27178 (13%) | |
50-59 Yrs | 736 (8%) | 11127 (12%) | 26537 (13%) | |
60-69 Yrs | 545 (6%) | 7863 (8%) | 20264 (9%) | |
70+ Yrs | 289 (3%) | 6096 (6%) | 15426 (7%) | |
Median HH Income | $42,792 | $54,929 | $55,033 | |
Total Household Income | < 24K | 884 (23%) | 6361 (18%) | 14283 (19%) |
25-49K | 1357 (35%) | 8796 (25%) | 19333 (25%) | |
50-74K | 811 (21%) | 8156 (24%) | 16116 (21%) | |
75-99K | 407 (10%) | 4784 (14%) | 10419 (13%) | |
100-199K | 294 (7%) | 5164 (15%) | 12564 (16%) | |
200K+ | 45 (1%) | 698 (2%) | 1726 (2%) | |
Highest Education Level | No Diploma | 758 | 5899 | 14871 |
Diploma or GED | 1603 | 16955 | 41006 | |
Some College | 1365 | 14020 | 31234 | |
Assoc. Degree | 500 | 5995 | 14027 | |
Bachelors Degree | 1079 | 12760 | 25739 | |
Higher Degree | 593 | 5883 | 11190 | |
Total Housing Units | 4,118 | 36,769 | 80,605 | |
--Owner-Occupied | 402 | 13,912 | 40,326 | |
--Renter-Occupied | 3,397 | 20,048 | 34,115 | |
Owner-Occupied Values | < 100K | 124 | 2361 | 8638 |
100-199K | 119 | 7458 | 18779 | |
200-299K | 114 | 3244 | 9929 | |
300-399K | 36 | 486 | 1820 | |
400-499K | 7 | 135 | 581 | |
500K+ | 3 | 227 | 578 | |
Total Working Age Population | 7,112 | 72,077 | 160,557 | |
In Work Force | 5,167 | 48,709 | 105,885 | |
Not In Work Force | 1,945 | 23,368 | 54,672 | |
Workforce Employed | 4,773 | 45,606 | 98,687 | |
Workforce Unemployed | 361 | 2,739 | 6,467 | |
Civlian Workforce | 5,134 | 48,345 | 105,154 | |
Military Workforce | 33 | 364 | 731 | |
Total Households | 3,799 | 33,960 | 74,440 | |
Family Households | 1,841 | 20,207 | 48,493 | |
Non-Family Households | 1,958 | 13,753 | 25,948 | |
Married Couple | 829 | 12,037 | 31,219 | |
Other Family | 1,012 | 8,170 | 17,273 | |
Married w/Child | 407 | 4,495 | 11,969 | |
Single Male w/Child | 98 | 928 | 2,095 | |
Single Female w/Child | 490 | 3,612 | 7,489 |
Population Change Last Two Decades - Plus Projection
2000 | % | 2010 | % | 2020 | % | 2030 | |
---|---|---|---|---|---|---|---|
Florida | 15,982,378 | +18 | 18,801,310 | +14 | 21,517,610 | +13 | 24,340,457 |
Hillsborough County | 998,948 | +23 | 1,229,226 | +19 | 1,466,803 | +16 | 1,708,550 |
Total Working Age Population:
Total Households:
Total Working Age Population:
Total Households:
Total Working Age Population:
Total Households: