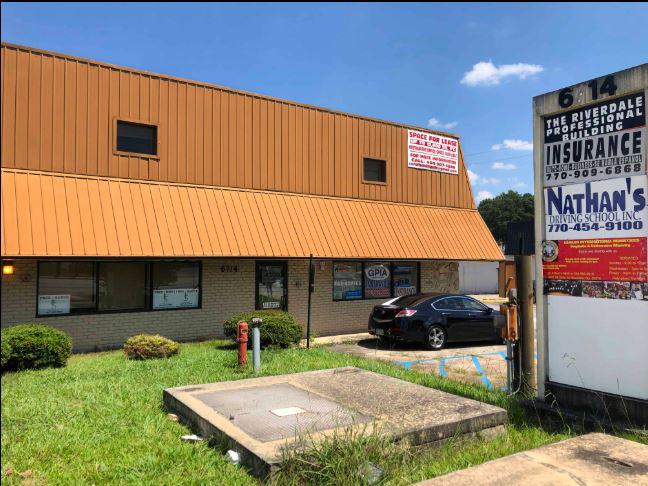
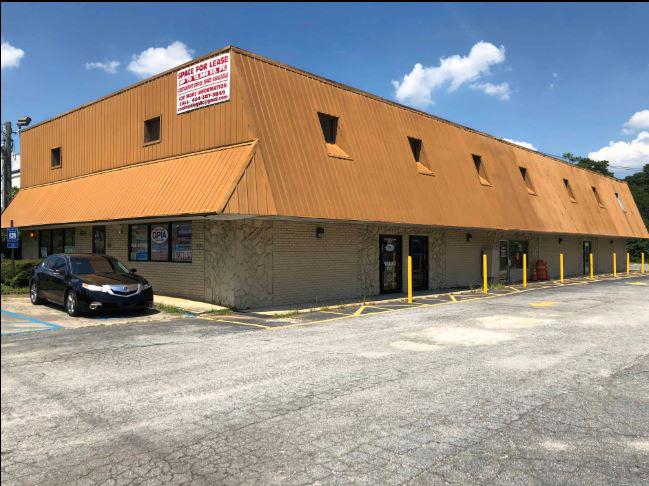
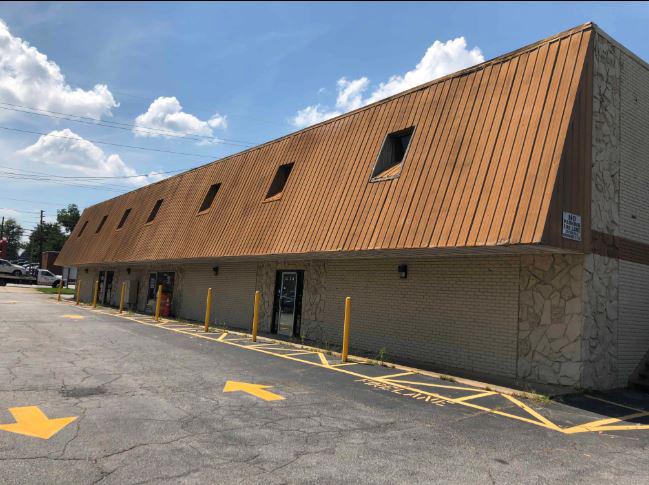
This investment offering is an excellent opportunity to acquire a multi-tenant office building at a 7%+ in-place cap rate that is 76% occupied with convenient sized spaces that appeal to a variety of local tenants. Immediate value-add potential is inherent through additional lease-up activities focused on the vacant space. Additionally, due to the smaller size of the spaces, tenants pay a much higher amount per square foot than the surrounding properties, providing additional upside potential in back-filling month to month tenants with new long term leases at above market per square foot rates. Every tenant also pays a pro rata share of CAM expenses for the property based on existing lease structures.Riverdale Professional center is located on a major retail corridor across the street from a Krispy Kreme, Popeyes and McDonald’s. Across Valley Hill Road is Riverdale Plaza Shopping Center anchored by a Food Depot, Dollar General, Pets World and Rent-A-Center. There are 48,100 vehicles passing per day on GA-85 and 24,672 vehicles per day on Valley Hill Road SE. There are 184,318 people living within a 5 miles radius, an increase of 8.05% since 2010.Riverdale is located approximately 12 miles south of Downtown Atlanta, which has benefited from the close proximity to the Atlanta International Airport. The airport is the world’s busiest airport, which caters to approximately 90 million passengers annually, and has an abundance of industries in the area due to the airport. The south side of Atlanta has experienced impressive growth over the past several years, with many developments occurring. Porsche recently opened their $100 million state of the art North American headquarters, located on 27 acres which included a test track and museum. A British film company, Pinewood Studios built a massive production facility for filming movies and television shows. There is also new construction distribution centers for Kroger and Home Depot. In addition, Atlanta Motor Speedway (NASCAR) is located approximately 13 miles south of Riverdale, and generates $500 million annually in tourism spending.To obtain full property financials, contact agent Charlie Carroll