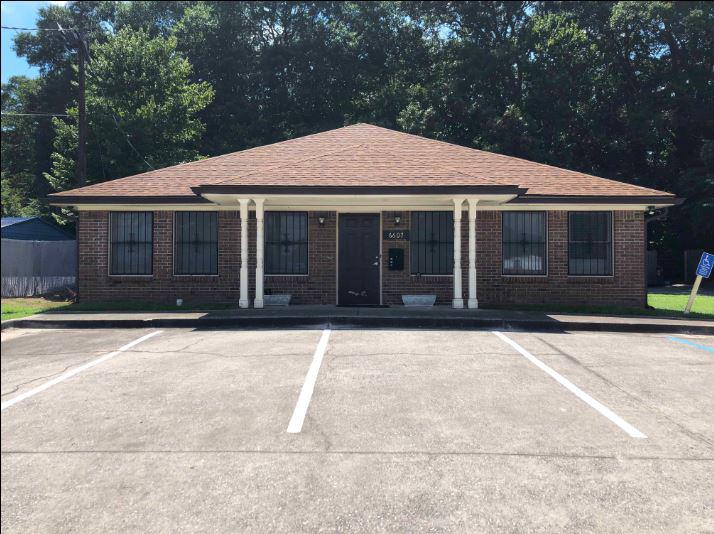
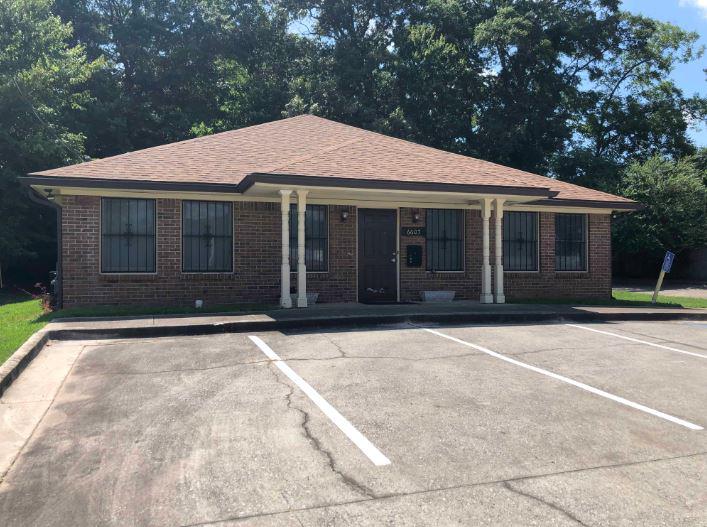
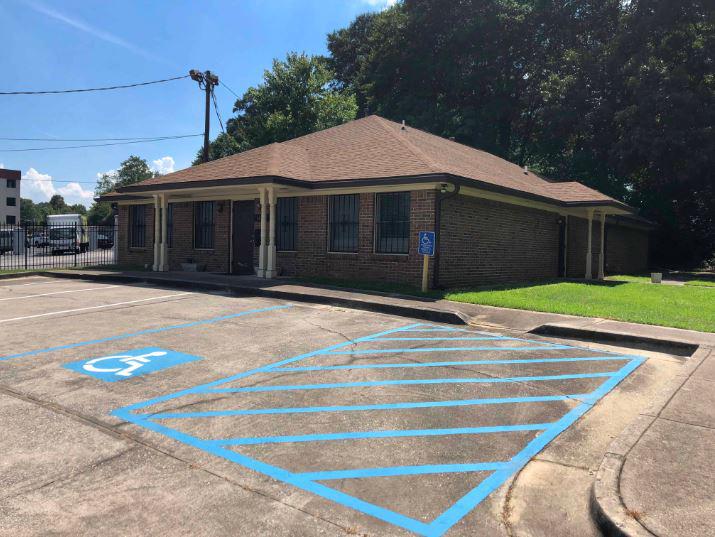
1-Mile | 3-Miles | 5-Miles | ||
---|---|---|---|---|
Total Population | 9,107 | 85,895 | 179,682 | |
Population Median Age | 35 | 32 | 33 | |
Population by Age | 0-9 Yrs | 1371 (15%) | 15049 (17%) | 29371 (16%) |
10-19 Yrs | 1160 (12%) | 12510 (14%) | 26649 (14%) | |
20-29 Yrs | 1337 (14%) | 14698 (17%) | 29641 (16%) | |
30-39 Yrs | 1637 (17%) | 12194 (14%) | 24588 (13%) | |
40-49 Yrs | 1165 (12%) | 11296 (13%) | 23904 (13%) | |
50-59 Yrs | 941 (10%) | 9633 (11%) | 21218 (11%) | |
60-69 Yrs | 981 (10%) | 6968 (8%) | 15756 (8%) | |
70+ Yrs | 516 (5%) | 3546 (4%) | 8555 (4%) | |
Median HH Income | $36,801 | $40,808 | $41,755 | |
Total Household Income | < 24K | 1096 (31%) | 8861 (29%) | 17765 (28%) |
25-49K | 1111 (32%) | 9119 (30%) | 18498 (30%) | |
50-74K | 657 (19%) | 5981 (20%) | 12336 (20%) | |
75-99K | 294 (8%) | 2949 (9%) | 6283 (10%) | |
100-199K | 267 (7%) | 2605 (8%) | 5611 (9%) | |
200K+ | 28 (0%) | 375 (1%) | 785 (1%) | |
Highest Education Level | No Diploma | 848 | 7111 | 16713 |
Diploma or GED | 2078 | 17712 | 37360 | |
Some College | 1426 | 12767 | 26101 | |
Assoc. Degree | 456 | 4703 | 9395 | |
Bachelors Degree | 859 | 6253 | 13012 | |
Higher Degree | 316 | 2901 | 6439 | |
Total Housing Units | 3,932 | 34,087 | 71,345 | |
--Owner-Occupied | 1,270 | 10,997 | 26,294 | |
--Renter-Occupied | 2,183 | 18,893 | 34,985 | |
Owner-Occupied Values | < 100K | 792 | 6454 | 14690 |
100-199K | 468 | 4077 | 9455 | |
200-299K | 6 | 307 | 1251 | |
300-399K | 0 | 70 | 363 | |
400-499K | 5 | 36 | 252 | |
500K+ | 0 | 54 | 283 | |
Total Working Age Population | 7,032 | 62,934 | 133,398 | |
In Work Force | 4,744 | 43,713 | 89,867 | |
Not In Work Force | 2,288 | 19,222 | 43,530 | |
Workforce Employed | 4,279 | 39,223 | 80,678 | |
Workforce Unemployed | 459 | 4,455 | 9,022 | |
Civlian Workforce | 4,738 | 43,678 | 89,700 | |
Military Workforce | 7 | 35 | 167 | |
Total Households | 3,453 | 29,890 | 61,279 | |
Family Households | 2,138 | 18,688 | 38,858 | |
Non-Family Households | 1,315 | 11,202 | 22,421 | |
Married Couple | 891 | 8,085 | 17,593 | |
Other Family | 1,247 | 10,602 | 21,265 | |
Married w/Child | 317 | 3,410 | 7,533 | |
Single Male w/Child | 196 | 1,234 | 2,068 | |
Single Female w/Child | 398 | 4,748 | 9,237 |
Population Change Last Two Decades - Plus Projection
2000 | % | 2010 | % | 2020 | % | 2030 | |
---|---|---|---|---|---|---|---|
Georgia | 8,186,453 | +18 | 9,687,653 | +10 | 10,694,980 | +9 | 11,709,700 |
Fulton County | 816,006 | +13 | 920,581 | +17 | 1,074,154 | +11 | 1,186,980 |
Clayton County | 236,517 | +10 | 259,424 | +15 | 299,477 | +17 | 349,752 |
Fayette County | 91,263 | +17 | 106,567 | +7 | 114,550 | +9 | 124,620 |
Total Working Age Population:
Total Households:
Total Working Age Population:
Total Households:
Total Working Age Population:
Total Households: