Description
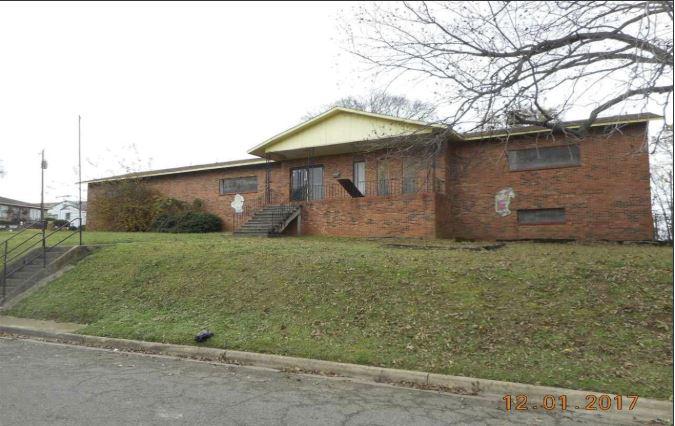
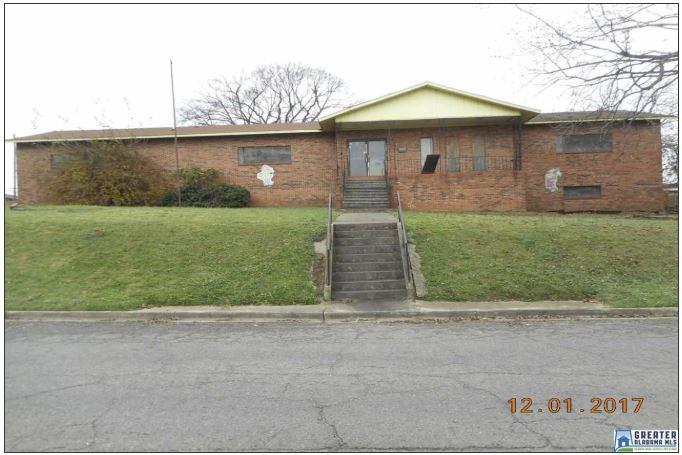
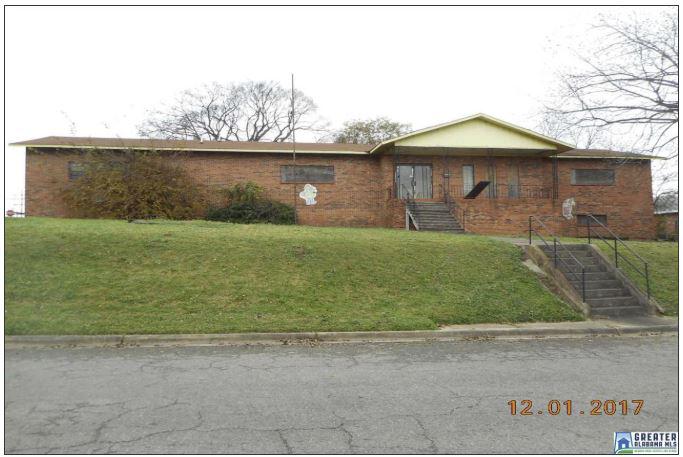
THIS GREAT CORNER LOT WAS ONCE A BOOMING DAYCARE, YOU CAN PURCHASE THIS DAYCARE WITH THE EQUIPMENT STILL INSIDE. THE SELLER IS SELLING AS-IS NO REPAIRS AND NO WARRANTIES.
Features
Property Type: Commercial
Sub Type: Office
Listing Status: Active
County/Area: Jefferson County
Zip Code: 35204
Year Built: 1977
Lot Size: 0.3900
Zoning: R3
Area: Inglenook, North Bham, Norwood, Tarrant
# Of Buildings: 1
Construction: Brick (Const)
Cooling: Central-Electric
Driving Directions: Heading North On I-65 Take The 16th Street Exit. Turn Left On 16th Terrace N And Go To The Stop Sign
Heating: No Heat
Parking: On Street, 1-5
Property Includes: Equipment, Fixtures
Property To Remain: Refrigerator
Rooms: Private Offices
Sale Includes: Building & Land
Sewer/Septic: Connected
Special Conditions Details: As Is
Sq Ft Lot: 16892
Sq Ft Office: 4228
Stories: 1
Street/Property Access: Paved Road
Water: Public Water
Year Built Desc: Existing
No part of this information may be copied, reproduced, repurposed, or screen-captured for any commercial purpose without prior written authorization from MyEListing.
While we strive to provide the most accurate information, all listing information, and demographic data, is provided by third-parties. As such, MyEListing will not be responsible for the accuracy of the information. It is strongly recommended that you verify all information with the listing agent, and any relevant agencies, prior to making any decisions.
What is the asking price for 1300 N 6th St in Birmingham?
The asking price for 1300 N 6th St is $127,000
What is the building size of this Office property in Birmingham, AL?
The size of the building/unit at 1300 N 6th St in Birmingham is 4,228 square feet
How much land does the Birmingham, AL property at 1300 N 6th St include?
1300 N 6th St in Birmingham includes 0.390 acres of land
What is the population within 1 mile of 1300 N 6th St in Birmingham?
The population within 1 mile of 1300 N 6th St Birmingham, AL 35203 is 6,197 people.
Who do I contact for questions about 1300 N 6th St?
You should contact the listing agent,
Abra Barnes, for any details regarding this commercial listing.