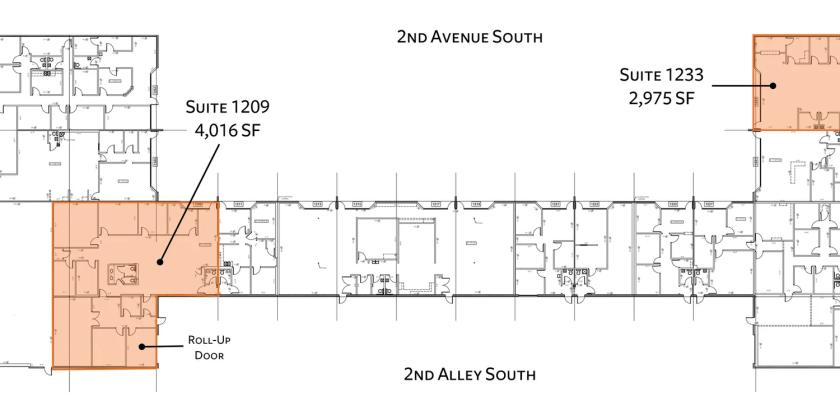
Office Space
1201 2nd Ave S Birmingham, AL 35233
1201 2nd Ave S Birmingham, AL 35233
Details & Description
Property Highlights
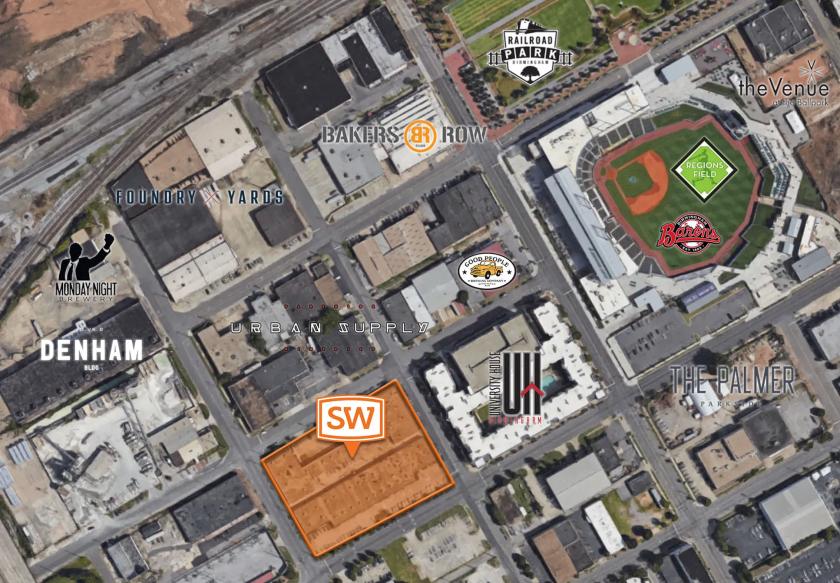
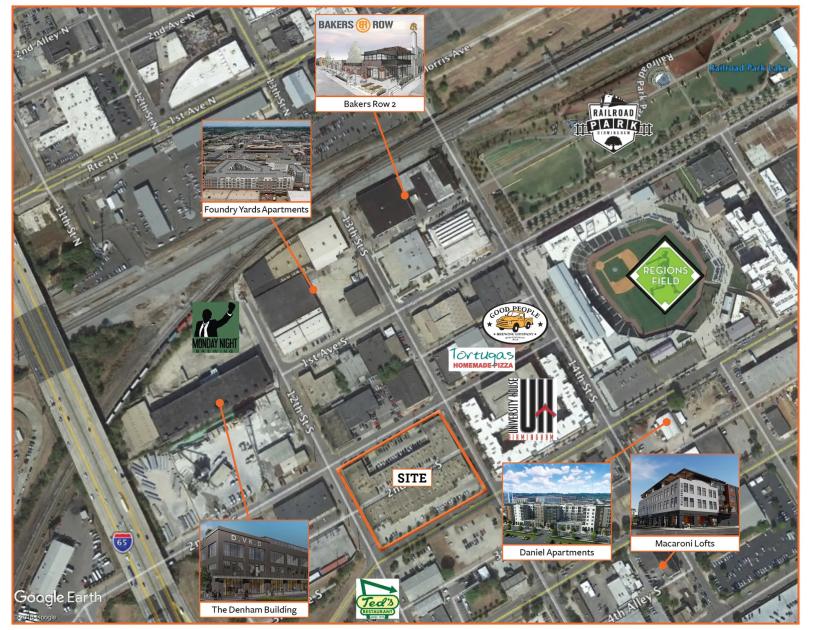
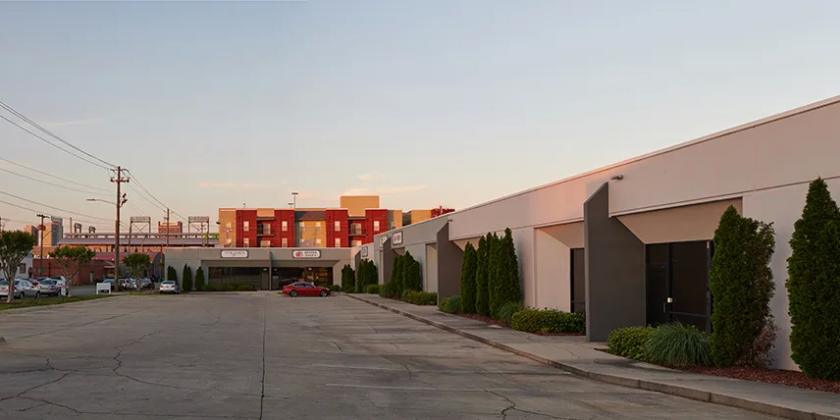
• Located adjacent to several of Birmingham's newest developments including Urban Supply, Foundry Yards, and Regions
• Parking: In addition to spaces in the lot immediately outside each suite, there are numerous street spaces nearby
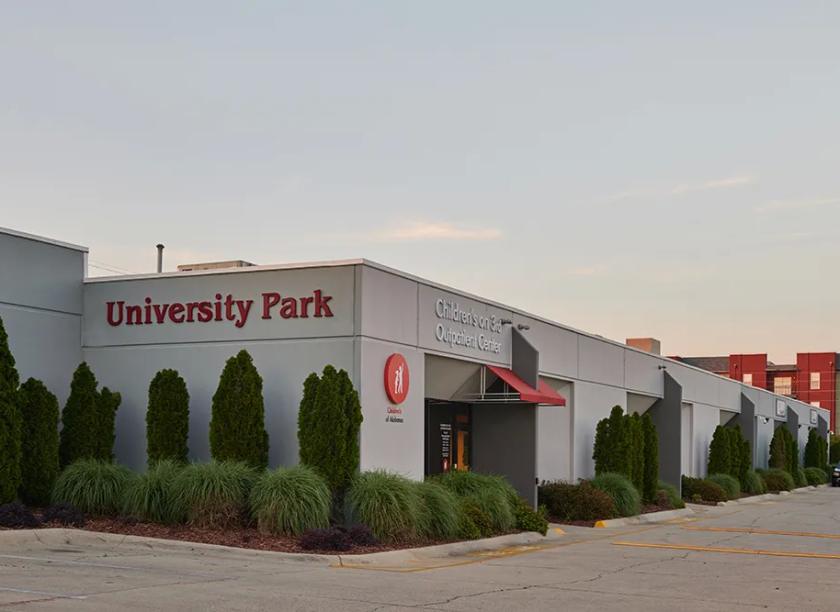
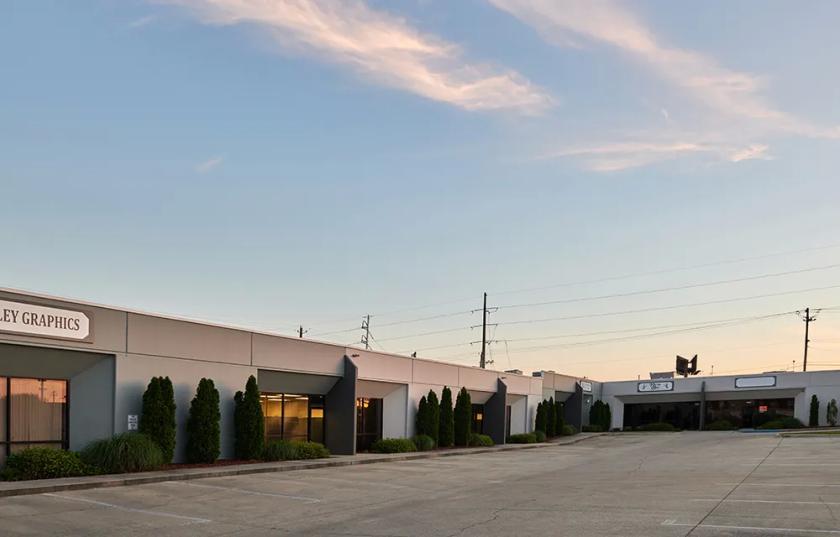
Additional Photos

Listing Agents

Anna Kate Teal
O: 205-977-9909
akt@shanwalt.com
O: 205-977-9909
akt@shanwalt.com
While we strive to provide the most accurate information, all listing information, and demographic data, is provided by third-parties. As such, MyEListing will not be responsible for the accuracy of the information. It is strongly recommended that you verify all information with the listing agent, and any relevant agencies, prior to making any decisions.