Retail Space
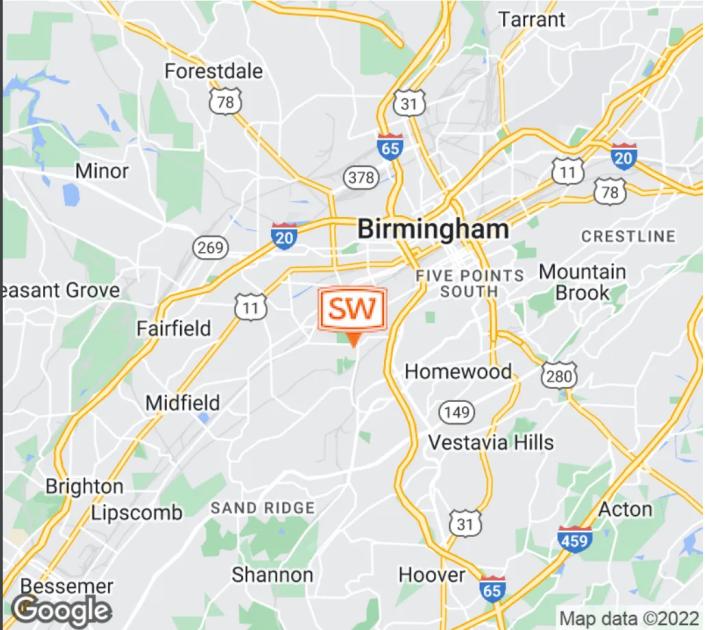
873 Dennison Ave SW Birmingham, AL 35211
873 Dennison Ave SW Birmingham, AL 35211
Details & Description
Property Highlights
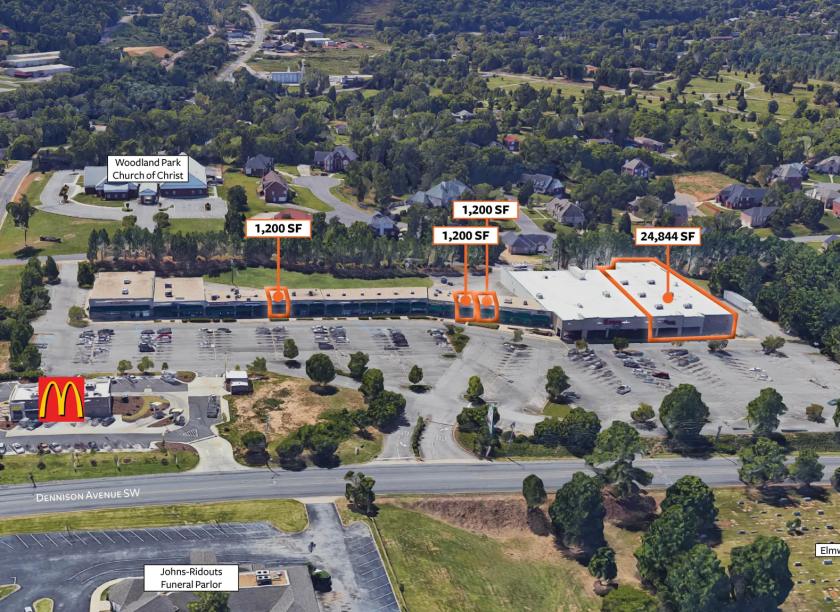
- • 24,844 SF End-cap Junior Box Available
- • 1,200 SF 2nd Generation Restaurant Space available
- • Excellent visibility with ample well lit, parking
- • Pylon signage opportunities
- • Traffic Count: 31,584 vehicles per day
Listing Agents

Anna Kate Teal
O: 205-977-9909
akt@shanwalt.com
O: 205-977-9909
akt@shanwalt.com
While we strive to provide the most accurate information, all listing information, and demographic data, is provided by third-parties. As such, MyEListing will not be responsible for the accuracy of the information. It is strongly recommended that you verify all information with the listing agent, and any relevant agencies, prior to making any decisions.