Retail Space
1808 Gadsden Hwy Birmingham, AL 35235
1808 Gadsden Hwy Birmingham, AL 35235
Details & Description
Property Highlights
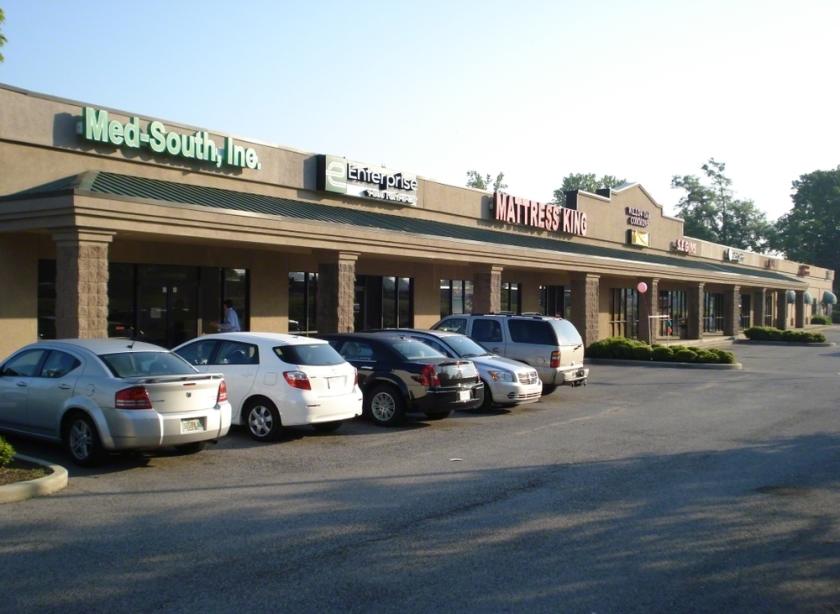
- • Great visibility
- • Only one space remaining
- • Accessible ingress/egress & parking
Listing Agents

Michael Murray
O: 205-977-9797
mm@shanwalt.com
O: 205-977-9797
mm@shanwalt.com
While we strive to provide the most accurate information, all listing information, and demographic data, is provided by third-parties. As such, MyEListing will not be responsible for the accuracy of the information. It is strongly recommended that you verify all information with the listing agent, and any relevant agencies, prior to making any decisions.


