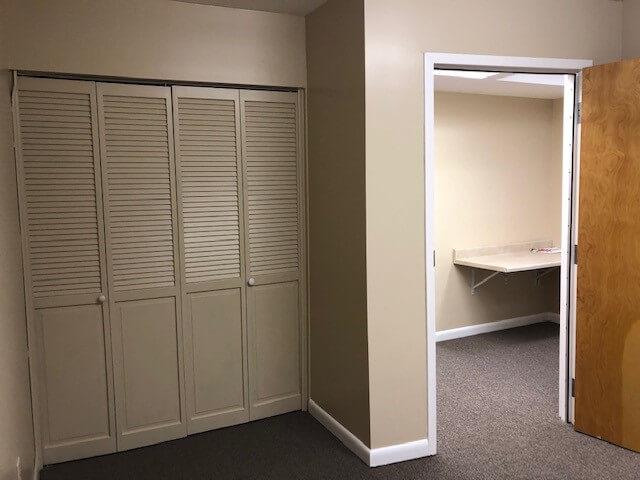
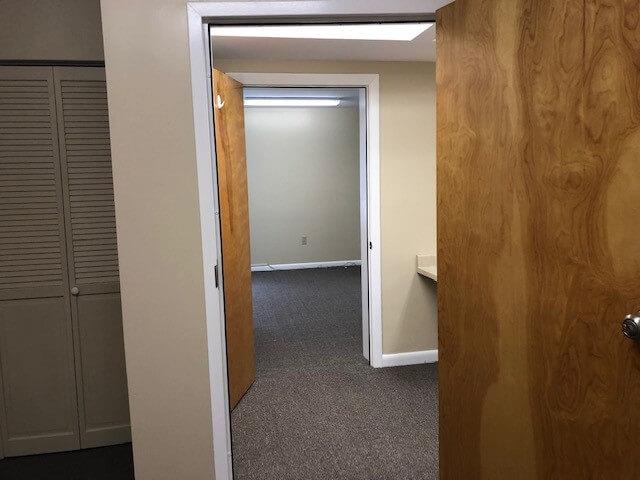
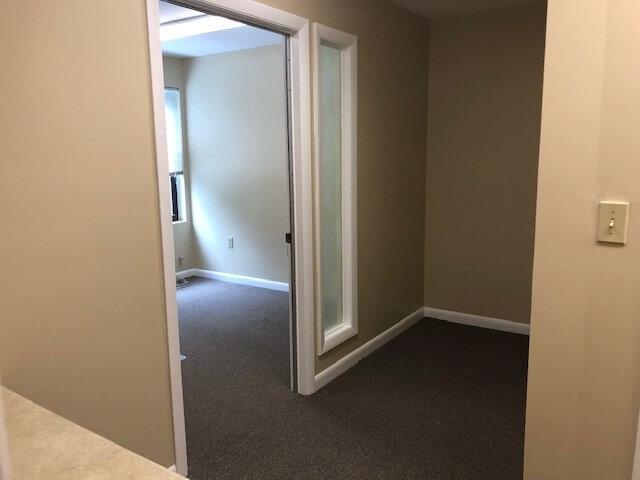
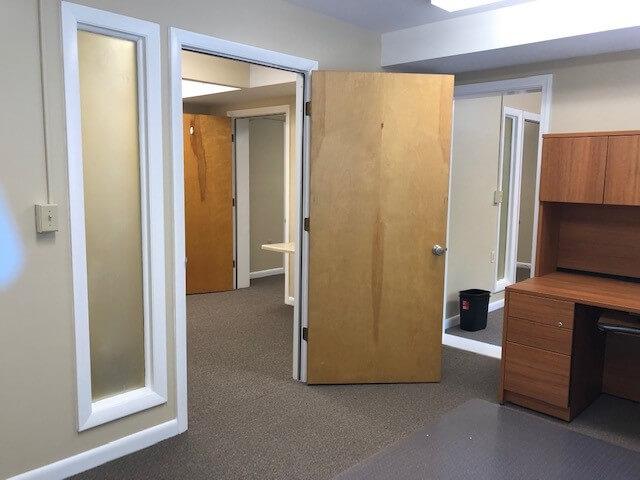
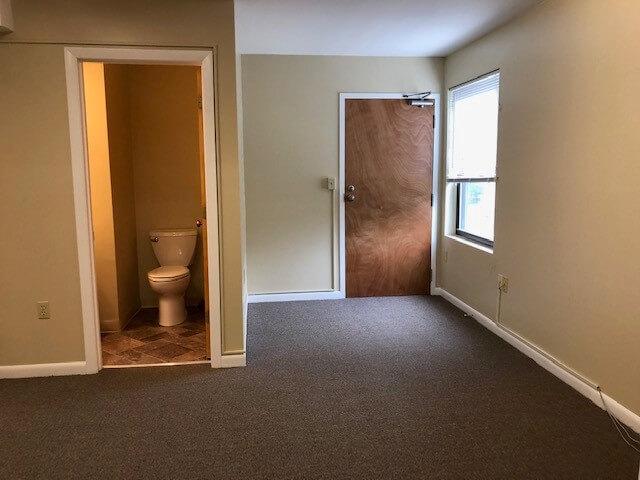
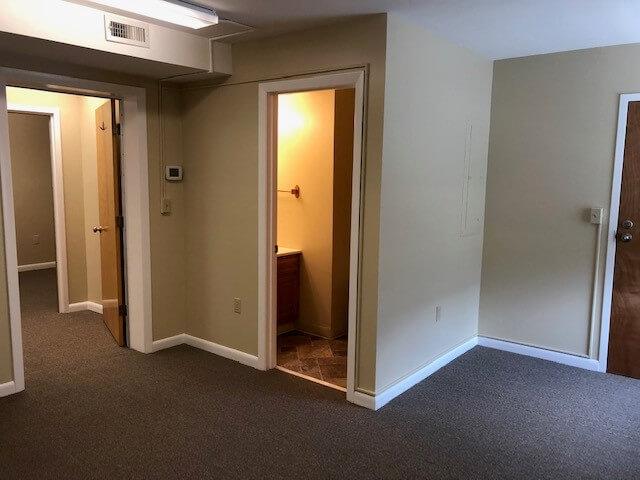
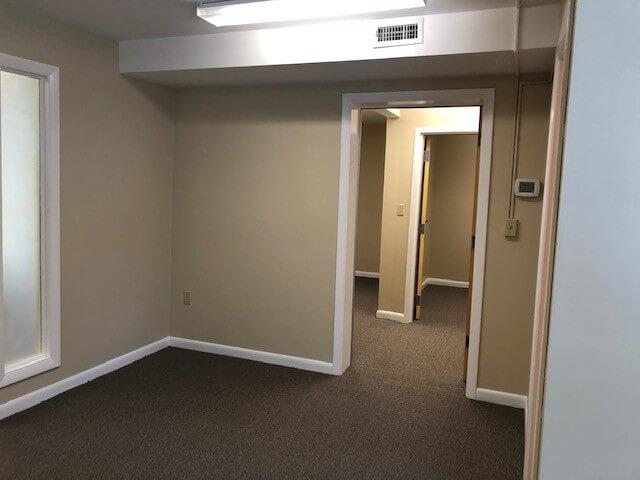
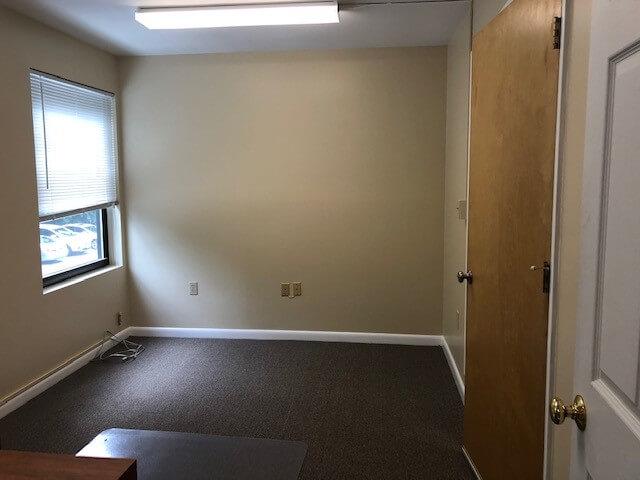
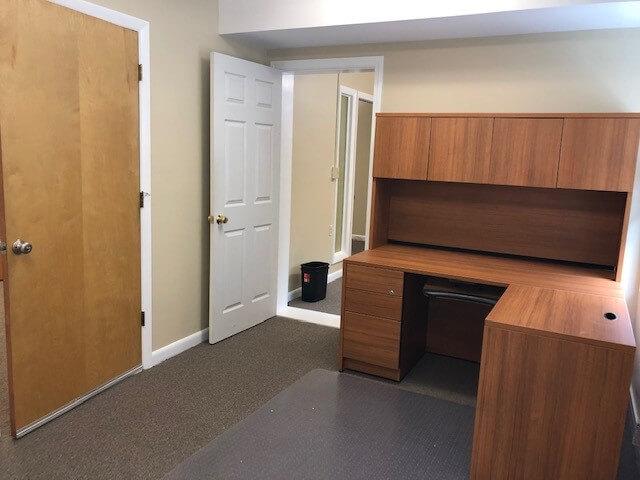
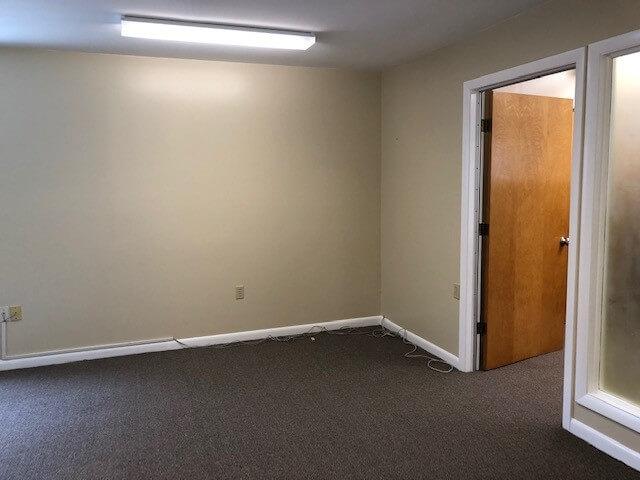
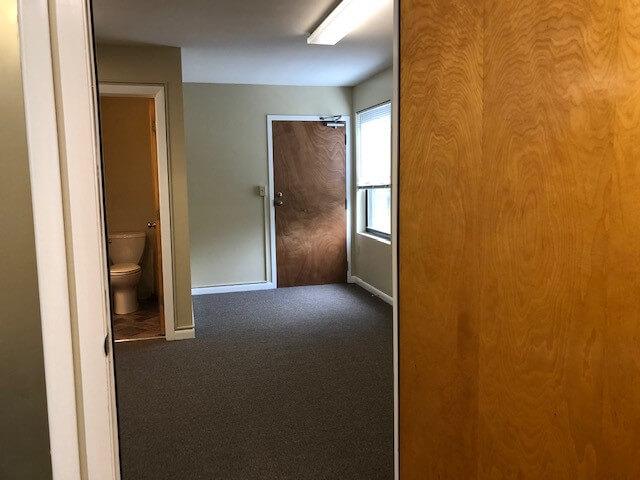
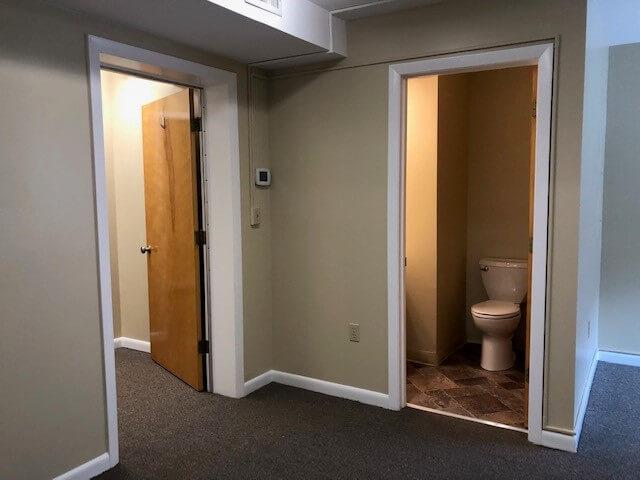
Office Space
495 Gold Star Hwy Groton, CT 06340
495 Gold Star Hwy Groton, CT 06340
Details & Description
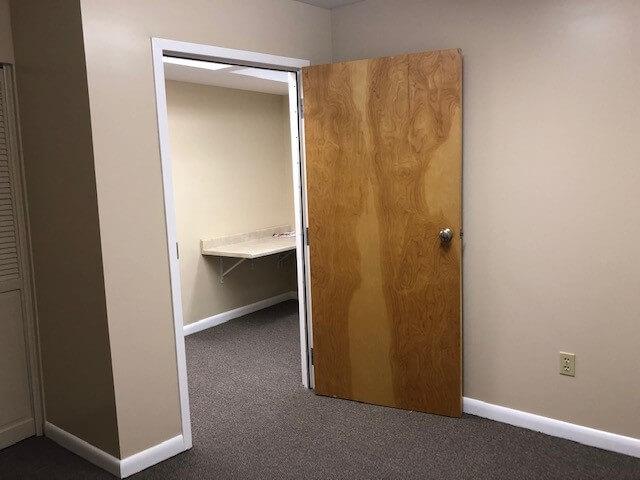
Additional Photos

Listing Agents

Mary Nasi
O: 860-213-8333
M: 860-908-6918
mary@imtrealestate.com
O: 860-213-8333
M: 860-908-6918
mary@imtrealestate.com
While we strive to provide the most accurate information, all listing information, and demographic data, is provided by third-parties. As such, MyEListing will not be responsible for the accuracy of the information. It is strongly recommended that you verify all information with the listing agent, and any relevant agencies, prior to making any decisions.