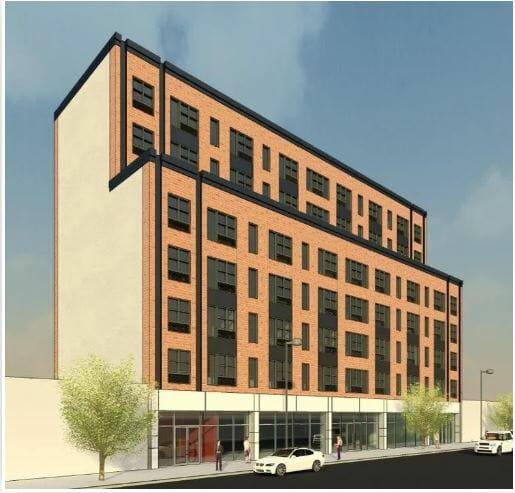
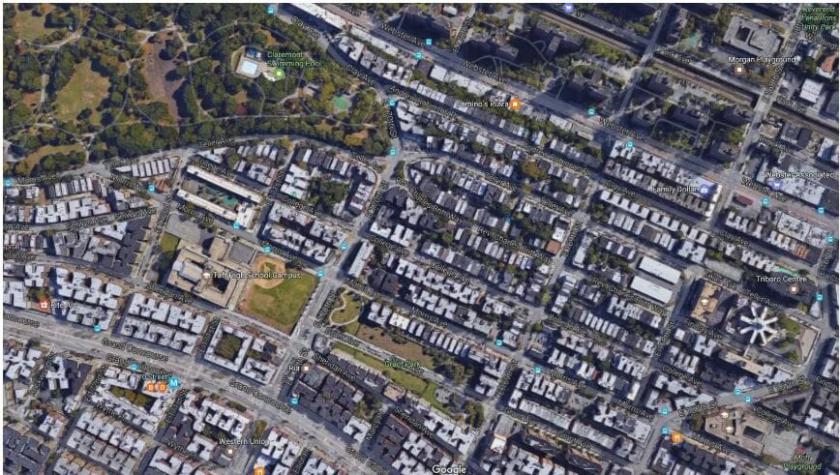
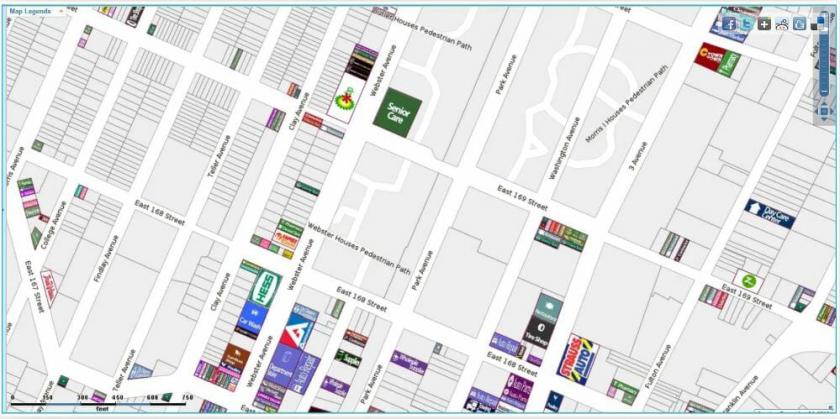
Leasing Details:Asking Price Per Square Foot$35.00 Size Available51,100 SFMinimum Divisible500 SFTotal Building SF55,000 SFLease TypeNNN DetailsHighlights:Neighborhood Features High population density neighborhood with nearly 1,200,000 people and 1,000,000 housing units within a 5-mile radius Webster Avenue provides good exposure on both foot and car traffic Surrounded by mid and high-rise apartment complexes Multiple schools surround the property such as: P.S. 55 Benjamin Franklin, P.S. 42, P.S 63 Author’s Academy, IS 219 New Venture School Bronx Center for Science and Mathematics Bronx Early College Academy Icahn Charter School Frederick Douglass Academy III Multiple Medical Centers surround the property such as: Triboro Center Bronx Lebanon Special Care & Hospital Center Morrisania Health Center Boston Road Medical Center Fulton Family Medicine Center MLK Health Center Surrounded by national and regional tenants with a spillover effect from the 3rd Avenue retail corridorBuilding Features Total Building size is roughly 50,000 SF on a lot size of 10,250 SF Currently a vacant lot being developed as a mixed-use building Good frontage exposure of 125feet on Webster Avenue, 82feet on East 170th Street Ground Floor Retail Availability of 10,250 SF Second Floor Retail/Office Availability of 10,250 SF Floors Three to Six Retail/Office Availability of 5,100 SF Per Floor Plate Built-to-suit opportunity ICAP Tax Abatement will be Secured Delivery Date is estimated to be Spring of 2019Transportation Several blocks away from the Grand Concourse Several blocks away from the Subway Lines B and D on 167th and 170th Street and the number 4 train on 167th Street going straight into Manhattan The Bx41 Bus stops right in front of the property