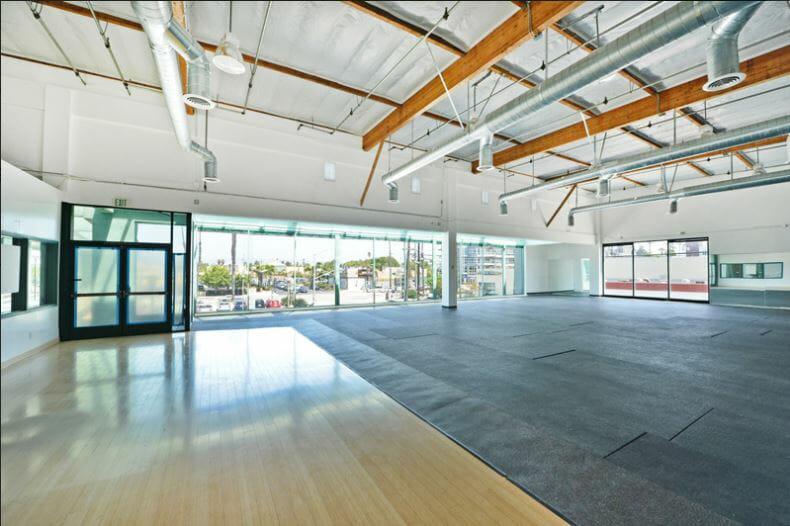
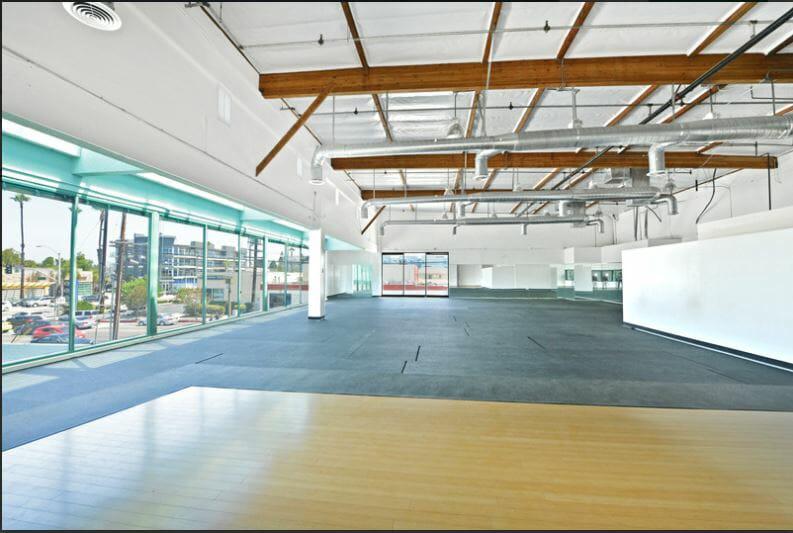
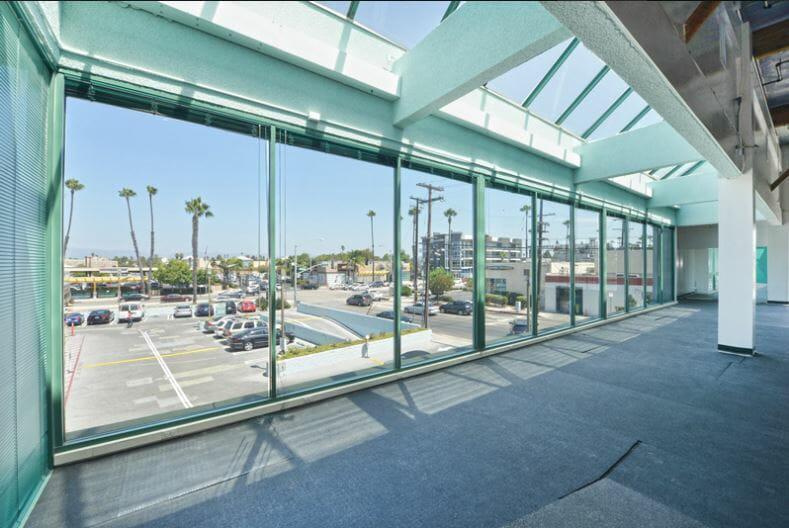
PROPERTY DESCRIPTIONMARINA COLLECTION SHOPPING CENTER – MULTIPLE SPACES FOR LEASESUITE 105: Approximately 1,294 square feetRATE: $2.80 per square foot per month plus NNNSUITE 111: Approximately 1,250 square feetRATE: $4.65 per square foot per month plus NNNSUITE 200: Approximately 4,751 square feetRATE: $1.95 per square foot per month plus NNNDIVISIBLE TO: Approximately 2,400 square feet & Approximately 2,351 square feetDIVISIBLE RATE: $2.55 per square foot per month plus NNNNNN: Estimated to be $1.20 per square foot per monthTERM: 3-5 yearsPARKING: Abundant surface & subterranean customer parking and elevator serviceAVAILABLE: ImmediatelyThe Marina Collection is in a premium Marina Del Rey location with excellent corner exposure. Anchored by Wells Fargo Bank and Burke Williams Simply Massage, this center is located in the heart of the thriving Marina Loft District at the signaled intersection of Glencoe Avenue and Washington Boulevard.• Adjacent to Costco, In-N-Out Burger, The Vitamin Shoppe and over 1800 new condominiums and high end townhouses with more residential units in construction and development within walking distance to the Marina Collection.• Over 90% occupied, the center offers fully improved retail/professional/creative space in a contemporary setting.• The Marina Collection is highly visible and offers tremendous signage, modern design, high volume ceilings, elevator access and much, much more!