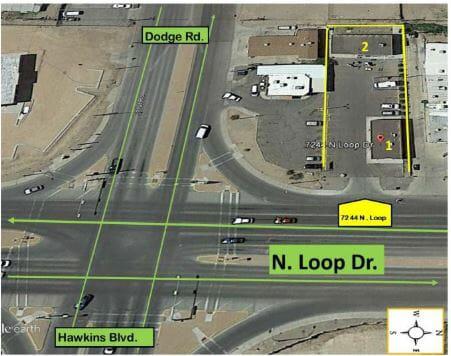
1-Mile | 3-Miles | 5-Miles | ||
---|---|---|---|---|
Total Population | 11,155 | 93,364 | 206,218 | |
Population Median Age | 41 | 40 | 39 | |
Population by Age | 0-9 Yrs | 1190 (10%) | 11323 (12%) | 25036 (12%) |
10-19 Yrs | 1606 (14%) | 12772 (13%) | 29544 (14%) | |
20-29 Yrs | 1536 (13%) | 13701 (14%) | 32869 (15%) | |
30-39 Yrs | 1193 (10%) | 10012 (10%) | 22870 (11%) | |
40-49 Yrs | 1137 (10%) | 11200 (11%) | 23530 (11%) | |
50-59 Yrs | 1372 (12%) | 12239 (13%) | 25820 (12%) | |
60-69 Yrs | 1448 (12%) | 8799 (9%) | 20629 (10%) | |
70+ Yrs | 1672 (14%) | 13318 (14%) | 25920 (12%) | |
Median HH Income | $34,947 | $36,660 | $37,873 | |
Total Household Income | < 24K | 1355 (36%) | 11055 (33%) | 23806 (33%) |
25-49K | 1283 (34%) | 10502 (31%) | 20807 (29%) | |
50-74K | 521 (14%) | 5772 (17%) | 12040 (17%) | |
75-99K | 288 (7%) | 2718 (8%) | 6178 (8%) | |
100-199K | 231 (6%) | 2788 (8%) | 6664 (9%) | |
200K+ | 6 (0%) | 433 (1%) | 999 (1%) | |
Highest Education Level | No Diploma | 2543 | 16675 | 33511 |
Diploma or GED | 1981 | 16898 | 35997 | |
Some College | 1665 | 13868 | 31216 | |
Assoc. Degree | 395 | 4167 | 9425 | |
Bachelors Degree | 700 | 6819 | 16182 | |
Higher Degree | 245 | 3323 | 7294 | |
Total Housing Units | 4,190 | 36,616 | 77,187 | |
--Owner-Occupied | 2,186 | 18,510 | 39,893 | |
--Renter-Occupied | 1,498 | 14,759 | 30,601 | |
Owner-Occupied Values | < 100K | 1580 | 9440 | 17394 |
100-199K | 549 | 7280 | 19178 | |
200-299K | 39 | 1470 | 2368 | |
300-399K | 7 | 166 | 566 | |
400-499K | 0 | 11 | 42 | |
500K+ | 11 | 143 | 345 | |
Total Working Age Population | 9,098 | 74,384 | 163,905 | |
In Work Force | 4,948 | 43,035 | 96,222 | |
Not In Work Force | 4,150 | 31,349 | 67,683 | |
Workforce Employed | 4,583 | 38,829 | 84,428 | |
Workforce Unemployed | 300 | 3,167 | 6,841 | |
Civlian Workforce | 4,884 | 41,995 | 91,269 | |
Military Workforce | 65 | 1,039 | 4,953 | |
Total Households | 3,684 | 33,268 | 70,494 | |
Family Households | 2,849 | 22,638 | 48,824 | |
Non-Family Households | 836 | 10,631 | 21,670 | |
Married Couple | 1,562 | 13,470 | 29,707 | |
Other Family | 1,287 | 9,168 | 19,117 | |
Married w/Child | 358 | 4,817 | 10,960 | |
Single Male w/Child | 53 | 458 | 1,386 | |
Single Female w/Child | 358 | 3,059 | 7,044 |
Population Change Last Two Decades - Plus Projection
2000 | % | 2010 | % | 2020 | % | 2030 | |
---|---|---|---|---|---|---|---|
Texas | 20,851,820 | +21 | 25,145,561 | +18 | 29,677,668 | +18 | 34,894,452 |
El Paso County | 679,622 | +18 | 800,647 | +9 | 876,120 | +7 | 936,697 |
Total Working Age Population:
Total Households:
Total Working Age Population:
Total Households:
Total Working Age Population:
Total Households: