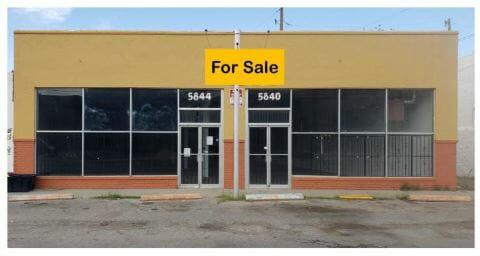
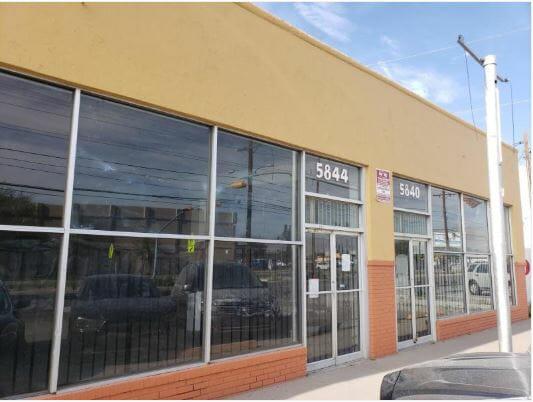
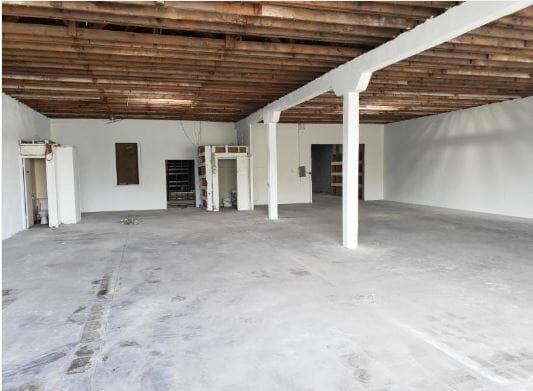
Multi Use Building located between Awbrey St. & Collingsworth St, four (4) blocks East of Fox Plaza Shopping Center between Chas Bank & Auto Zone. Open floor plan that lends it's self to many uses for example retail, mechanic shop, office / warehouse, electrical or plumbing company. Building has two (2) store front entrances. Can be subdivided into two (2) separate business. In the rear of property is a +/- 3,700 sq. ft. open metal canopy. Additional access from Collingsworth Dr. OWNER FINANCING AVAILABLE!!!Primary FeaturesCounty El PasoOff Market DateProperty Type CommercialSold DateSold PriceSubdivision CollingsworthZoning C4Financial DetailsApproximate Yearly Taxes 7973Exemptions NoneLease Info Call Listing OfficeLease Terms SaleLeaseable Area Y/NNumber Of Tenants 0Packages Includes Contact LASale Includes Sale OnlyTax Year 2018Tenant PaysAdditionalBest Use Child Care, Church, Retail, WarehouseEmpowerment Zone NoImproved YesMeasured By Appraiser CADProperty Building, Land (Fee Simple), Other ImprovementsSource Dimensions OtherVerification Information LimitedExternal FeaturesConstruction Brick VeneerDockFinance Considered Cash, Owner Will CarryHandicap Access YesLot YesLot SqFt 17090Miscellaneous ExteriorNumber Of Parking SpacesParkingProperty Access Paved Road to PropUtilities All CityInterior FeaturesCooling NoneFinished Space yesHeating Natural GasRefrigerated NoLocation InformationFlood Zone YesLocation Freestanding