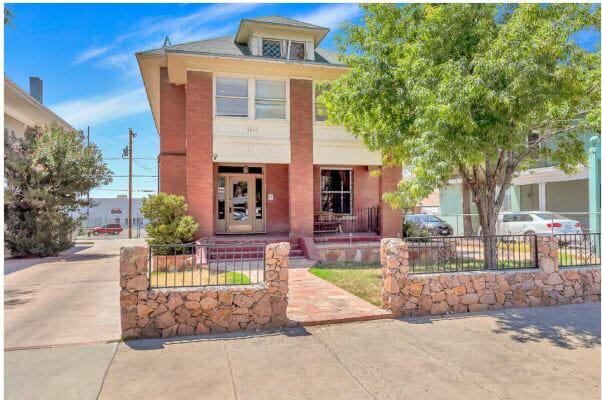
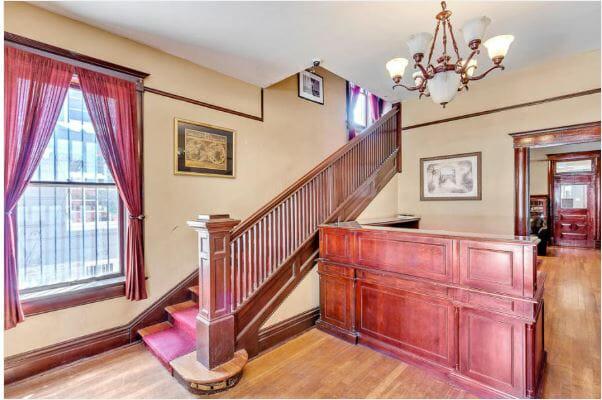
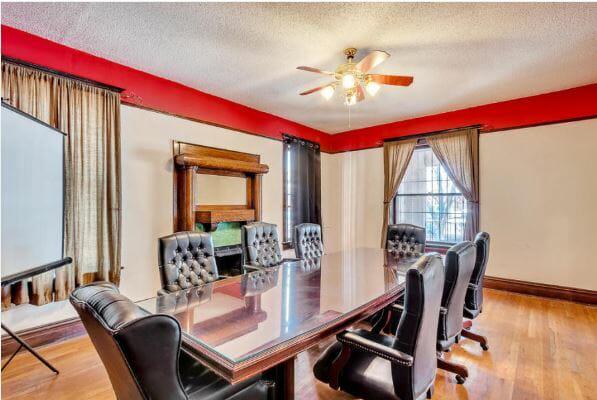
Beautifully preserved home prominent and easily accessible in prime business district, great for professional services, Attorney, Accounting, Engineering, etc. Property consists of 2 floor plan, entrance boasting reception & waiting area adjacent to conference room, equipment spot, full kitchen, stairwell leading to completed basement. Basement area has 1,678 sq.ft for additional office or storage area. Second stairwell leads to upper level, featuring 4 rooms designed for office use and a whole lot of privacy, bath and additional equipment area. Hardwood flooring throughout, property has been maintained and shows pride of ownership. Comfortable atmosphere for clients. Parking lot accessed through alley in rear as well as front driveway. Easy access to downtown restaurants, I-10. PRIME OPPORTUNITY! ACT FAST--IT WILL NOT LAST LONG ON MARKET.Primary FeaturesCounty El PasoOff Market DateProperty Type CommercialSold DateSold PriceSubdivision Franklin HeightsZoning A2Financial DetailsApproximate Yearly TaxesExemptions UnknownLease InfoLease Terms NoneLeaseable Area Y/NNumber Of Tenants 0Packages IncludesSale Includes Building and LandTax YearTenant Pays See RemarksAdditionalBest Use Professional/OfficeEmpowerment Zone NoImproved YesMeasured By Appraiser CADProperty Building, See RemarksSource Dimensions OtherVerification Information LimitedExternal FeaturesConstruction Brick, Wood SidingDockFinance Considered Cash, ConventionalHandicap Access NoLotLot SqFt 6750Miscellaneous ExteriorNumber Of Parking Spaces 6Parking See RemarksProperty Access Paved Road to PropUtilities All City, All UtilitiesInterior FeaturesCooling 2+ Units, RefrigeratedFinished SpaceHeating 2+ Units, CentralRefrigeratedLocation InformationFlood Zone NoLocation Downtown Area, See Remarks