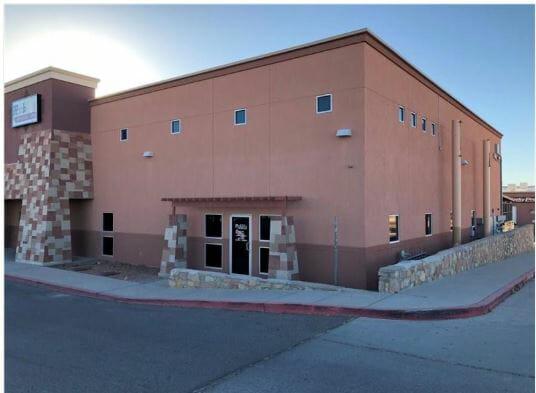
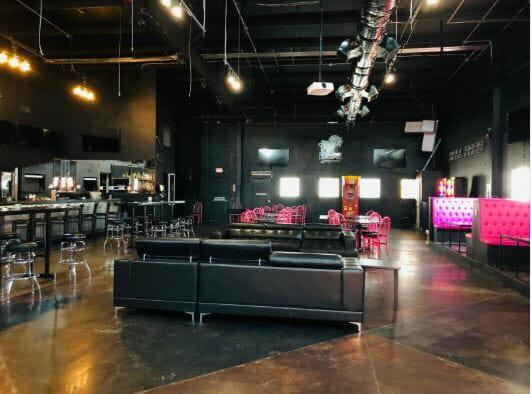
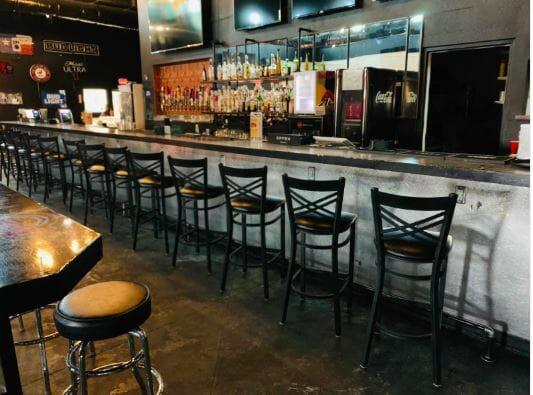
Corner space of the James Watt Condominiums, the property has 2-2,250 sq. ft. spaces, excellent CAP rate, recently remodeled to accommodate a bar, DTF Bar & Grill and prior to, Mavericks, it can be turned into a different use (Party hall, Lounge, etc..) even though it has over $250,000 of improvements. For example: Walk in cooler, 1000 gallon grease trap, venti-hood and fire suppressant system, Fire standards rating compliant, 2-10 ton separate refrigerated A/C units, Single and 3 phase electrical, 2 hr firewall between suites, to name a few. Exterior Patio of additional 600 square feet! Great visibility! Exit Lee Trevino on I-10 going north to James Watt before Pellicano. Make your vision of a bar,/lounge come true!Primary FeaturesCounty El PasoOff Market DateProperty Type CommercialSold DateSold PriceSubdivisionZoning C4Financial DetailsApproximate Yearly Taxes 9602Exemptions NoneLease Info Call Listing Office, See RemarksLease Terms Other, SaleLeaseable Area Y/N yesNumber Of Tenants 1Packages Includes Building LeaseSale Includes Building and Land, LeaseTax Year 2017Tenant PaysAll Utilities, Exterior Maintenance, HVAC Maintenance, Internal Repairs, LiabilityAdditionalBest UseBar/Tavern/Lounge, Distribution, Franchise, Medical, Professional/Office, Restaurant, See RemarksEmpowerment Zone NoImproved YesMeasured By Appraiser CADProperty CondoSource Dimensions Owner ProvidedVerification Information LimitedExternal FeaturesConstruction ConcreteDockFinance Considered Cash, ConventionalHandicap Access YesLotLot SqFt 95914Miscellaneous Exterior Dumpster Lease/Rented, Sign OwnedNumber Of Parking Spaces 15Parking Assigned, UnassignedProperty Access Paved Road to PropUtilitiesAll City, All Utilities, Cable TV - Available, Fire SuppressantInterior FeaturesCooling 2+ Units, RefrigeratedFinished Space yesHeating Central, Forced AirRefrigerated YesLocation InformationFlood Zone NoLocation Business Center, Corner Lot, Office Park